

Storm description, surface observations, snowfall totals, and images courtesy of the National Climatic Data Center, the National Centers of Environmental Prediction, the Climate Prediction Center, the Hydrometeorological Prediction Center, the Mount Holly National Weather Service Office, the Upton National Weather Service Office, Rutgers University,Plymouth State University, the University of Illinois, the American Meteorological Society, Weather Graphics Technologies, AccuWeather, and the Weather Channel.
Table of Contents
Storm Summary
Regional Surface Observations
National Weather Service Forecasts
Surface Maps
Satellite Imagery
National Surface Weather Maps - Pressure and Fronts Only
Sea Level Pressure and 1000 to 500 Millibar Thickness Maps
850 Millibar Maps
700 Millibar Maps
500 Millibar Maps
300 Millibar Maps
200 Millibar Maps
National Radar Imagery
Contoured Snowfall Totals from March 13-14, 1993
STORM DESCRIPTION
The "Blizzard of '93", also known as the "Superstorm '93" and the first coined "Storm of the Century" during the 1990's, was an extremely intense nor'easter which impacted New Jersey with a wide variety of hazardous weather.
Synoptic Discussion
The low center was born in the Gulf of Mexico and then moved from southeastern states northward along the Atlantic coast, through central New Jersey and then northeastwards into New England. It deepened rapidly and had a record low minimum central pressure of 28.38 inches of mercury (961 millibars), which occured at almost the same time as it passed over New Jersey. It was one of the most powerful storms (tropical or extratropical) to hit New Jersey on record.
Local Discussion
Snow began across New Jersey between 1am EST and 3am EST on the early morning of the 13th. Snow became very heavy during the morning hours. It changed to sleet and then quickly to rain between 11am EST and 12pm EST in southeastern sections and between 12pm EST and 1pm EST in southwestern and east central sections. Meanwhile, the snow changed to sleet in west central and northern sections between 12pm EST and 2pm EST, and generally remained sleet with some freezing rain or rain mixed in for most of the next 10 hours. Rain (in the southern and east central sections) and sleet (in the west central and northern sections) lasted until 11pm EST before turning back to snow, which lasted until around 6am EST on the 14th. Accumulations ranged from 3 to 6 inches on the southeastern sections, 6 to 14 inches in east central and southwestern sections, 10 to 18 inches in west central and northeastern sections, and 15 to 26 inches in northwestern sections. Winds were sustained at 30 mph to 45 mph, with gusts to 75 mph (hurricane force) measured in Cape May. Moderate coastal flooding occured the morning of the 13th as a result of the high winds, tides, and pounding surf, with waves of 6 to 8 feet above high tide levels. Tide levels reached 7 to 7.5 feet above mean low water in the back bays.
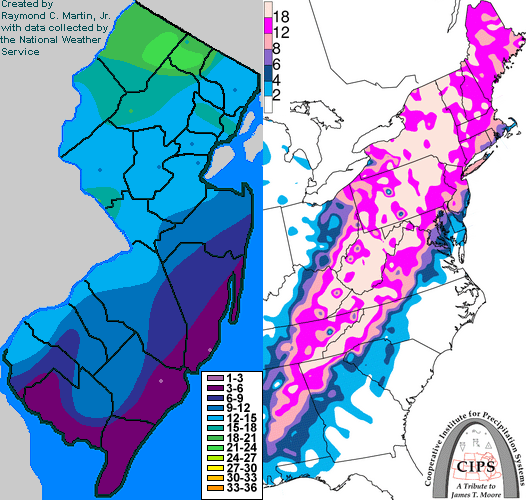
New Jersey Snowfall Totals
Individual Snowfall Totals from March 13-14, 1993
Regional Snowfall Totals
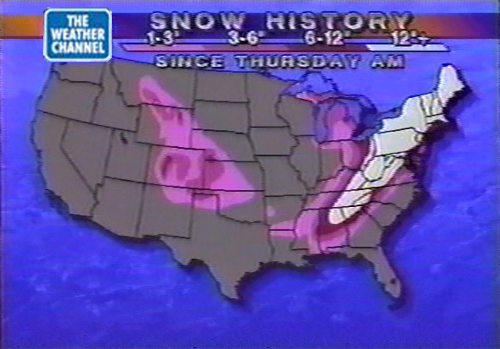
Snow Totals from 2300Z 14 March 1993 (6PM EST 14 March 1993)
Final Snowfall Totals from March 12-14, 1993
Table of Contents
Storm Summary
Regional Surface Observations
National Weather Service Forecasts
Surface Maps
Satellite Imagery
National Surface Weather Maps - Pressure and Fronts Only
Sea Level Pressure and 1000 to 500 Millibar Thickness Maps
850 Millibar Maps
700 Millibar Maps
500 Millibar Maps
300 Millibar Maps
200 Millibar Maps
National Radar Imagery
Back to Ray's Winter Storm Archive
Copyright © 2012 by Raymond C Martin Jr. All rights reserved