

Storm description, surface observations, snowfall totals, and images courtesy of the National Climatic Data Center, the National Centers of Environmental Prediction, the Climate Prediction Center, the Hydrometeorological Prediction Center, the Mount Holly National Weather Service Office, the Upton National Weather Service Office, Rutgers University, Plymouth State University, the University of Illinois, the American Meteorological Society, Weather Graphics Technologies, AccuWeather, and the Weather Channel.
Table of Contents
Storm Summary
Regional Surface Observations
National Weather Service Forecasts
Surface Maps
Satellite Imagery
National Surface Weather Maps - Pressure and Fronts Only
Sea Level Pressure and 1000 to 500 Millibar Thickness Maps
850 Millibar Maps
700 Millibar Maps
500 Millibar Maps
300 Millibar Maps
200 Millibar Maps
National Radar Imagery
Local Radar Imagery
Fort Dix Doppler Radar Imagery
Storm Photos
Contoured Snowfall Totals from December 30, 2000
STORM DESCRIPTION
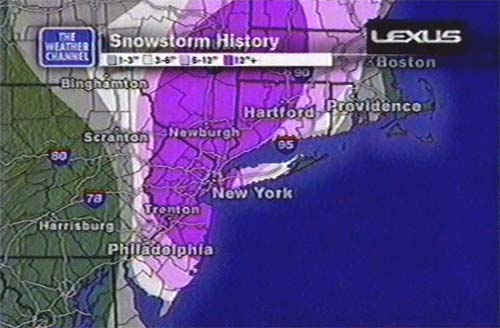
The first widespread winter storm of the season blanketed New Jersey, especially the northern half, with the heaviest snowfall since the Blizzard of '96.
Synoptic Discussion
The low pressure system developed just east of Elizabeth City, North Carolina on the evening of the 29th. At 5AM EST on the 30th it was located 75 miles east of Cape Charles, Virginia, and by 9AM EST it was 50 miles east of the mouth of the Delaware Bay. The low then slowed and intensified more rapidly. It finally crossed the Twin Forks of Long Island, New York by 5PM EST, with a central pressure of 992 millibars (down 10 millibars in 8 hours).
Local Discussion
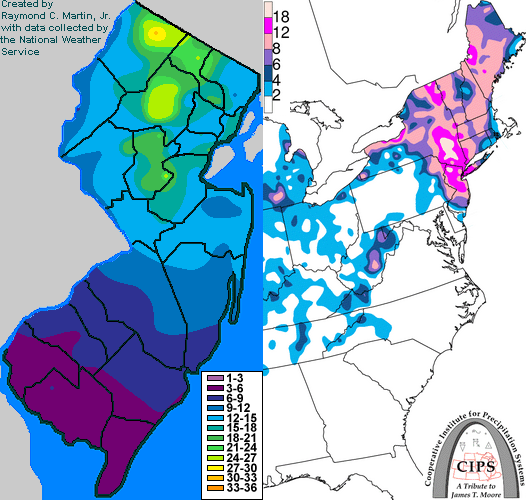
The snow began between 3AM EST and 5AM EST across most of the state and fell heavy at times during the morning. By the afternoon, the low had moved too far north and the heavy snow moved north of southern New Jersey. However, the snow remained and even intensified across sections of northern New Jersey. Snowfall rates of 2 to 3 inches per hour were common in the heavy bands throughout the state during the morning and afternoon, while rates reached 4 or more inches per hour in thunderstorms over Sussex and Morris counties. The snow finally tapered off in the early evening. Snow accumulations were 14 to 30 inches in Sussex, Morris, Somerset, and Passaic counties. 12 to 18 inches fell in Bergen, Hudson, Essex, Union, Middlesex, Monmouth, Mercer, Huterdon, and Warren counties. 8 to 12 inches fell in Burlington and Ocean counties. 6 to 8 inches fell in Gloucester, Camden, and Atlantic counties, and 4 to 6 inches fell in Salem, Cumberland, and Cape May counties.
New Jersey Snowfall Totals
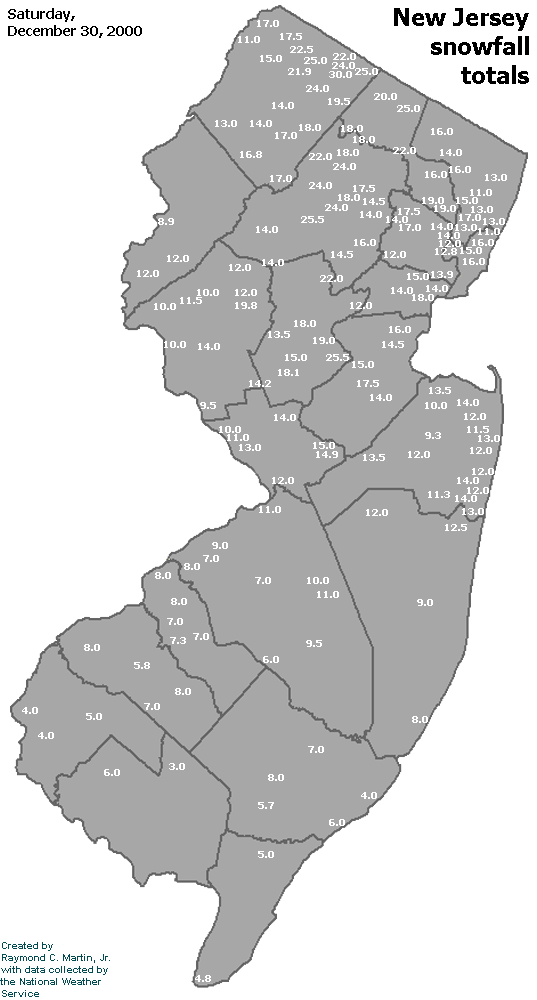
Individual Snowfall Totals from December 30, 2000
Regional Snowfall Totals
Snow Totals from 0200Z 31 December 2000 (9PM EST 30 December 2000)
Table of Contents
Storm Summary
Regional Surface Observations
National Weather Service Forecasts
Surface Maps
Satellite Imagery
National Surface Weather Maps - Pressure and Fronts Only
Sea Level Pressure and 1000 to 500 Millibar Thickness Maps
850 Millibar Maps
700 Millibar Maps
500 Millibar Maps
300 Millibar Maps
200 Millibar Maps
National Radar Imagery
Local Radar Imagery
Fort Dix Doppler Radar Imagery
Storm Photos
Snow storm, December 19-20, 2000
Snow storm, December 22, 2000
Snow storm, December 30, 2000
Snow storm, January 5, 2001
Snow and ice storm, January 20-21, 2001
Snow storm, February 5, 2001
Snow storm, February 22, 2001
Snow and ice storm, March 4-6, 2001
Back to Ray's Winter Storm Archive
Copyright © 2012 by Raymond C Martin Jr. All rights reserved