

Storm description, surface observations, snowfall totals, and images courtesy of the National Climatic Data Center, the National Centers of Environmental Prediction, the Climate Prediction Center, the Hydrometeorological Prediction Center, the Mount Holly National Weather Service Office, the Upton National Weather Service Office, Rutgers University, Plymouth State University, the University of Illinois, the American Meteorological Society, Weather Graphics Technologies, AccuWeather, and the Weather Channel.
Table of Contents
Storm Summary
Regional Surface Observations
National Weather Service Forecasts
Surface Maps
Satellite Imagery
National Surface Weather Maps - Pressure and Fronts Only
Sea Level Pressure and 1000 to 500 Millibar Thickness Maps
850 Millibar Maps
700 Millibar Maps
500 Millibar Maps
300 Millibar Maps
200 Millibar Maps
National Radar Imagery
Fort Dix Doppler Radar Imagery
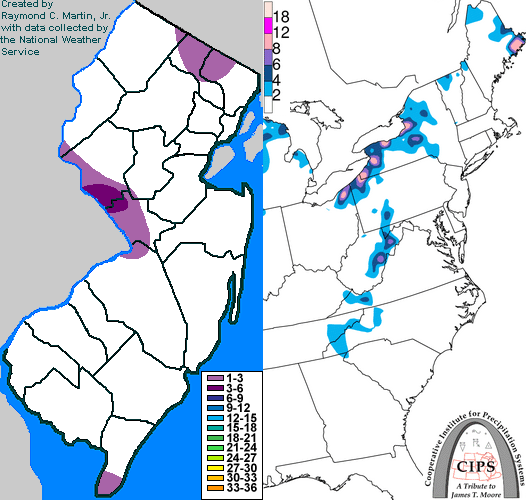
Contoured Snowfall Totals from February 4, 2002
STORM DESCRIPTION
Intense snow squalls along an Arctic cold front produced a quick burst of heavy snow across west central New Jersey.
Synoptic Discussion
An Alberta Clipper moved southward out of Canada into the northern Plains early on the 3rd. It moved across the Great Lakes late on the 3rd and early on the 4th, and moved across the Northeast later on the 4th. The storm moved out over the open Atlantic early on the 5th.
Local Discussion
Snow showers associated with the cold front moved through New Jersey during the afternoon and early evening of the 4th. In most areas, they produced only a dusting or coating of snow. However, stronger snow squalls moved over parts of west central New Jersey and were heavy enough to drop several inches of snow. Southern and western parts of Hunterdon County saw 2 to 4 inches of snow, while western Mercer County recieved 1 to 3 inches. Other sections of those counties, along with the rest of the state, generally recieved less than 1 inch of snow.
New Jersey Snowfall Totals
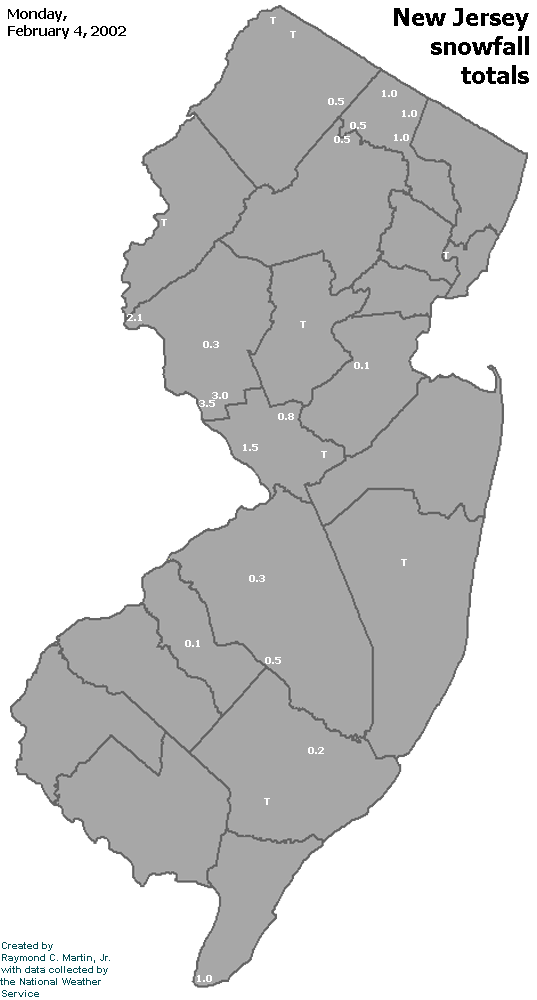
Individual Snowfall Totals from February 4, 2002
Table of Contents
Storm Summary
Regional Surface Observations
National Weather Service Forecasts
Surface Maps
Satellite Imagery
National Surface Weather Maps - Pressure and Fronts Only
Sea Level Pressure and 1000 to 500 Millibar Thickness Maps
850 Millibar Maps
700 Millibar Maps
500 Millibar Maps
300 Millibar Maps
200 Millibar Maps
National Radar Imagery
Fort Dix Doppler Radar Imagery
Snow storm, January 19-20, 2002
Snow storm, February 4, 2002
Back to Ray's Winter Storm Archive
Copyright © 2012 by Raymond C Martin Jr. All rights reserved