

Storm description, surface observations, snowfall totals, and images courtesy of the National Climatic Data Center, the National Centers of Environmental Prediction, the Climate Prediction Center, the Hydrometeorological Prediction Center, the Mount Holly National Weather Service Office, the Upton National Weather Service Office, Rutgers University, Plymouth State University, the University of Illinois, the American Meteorological Society, Weather Graphics Technologies, AccuWeather, and the Weather Channel.
Table of Contents
Storm Summary
Regional Surface Observations
National Weather Service Forecasts
Surface Maps
Satellite Imagery
National Surface Weather Maps - Pressure and Fronts Only
Continental Surface Weather Maps - Pressure and Fronts Only
Sea Level Pressure and 1000 to 500 Millibar Thickness Maps
850 Millibar Maps
700 Millibar Maps
500 Millibar Maps
300 Millibar Maps
200 Millibar Maps
National Radar Imagery
Regional Radar Imagery
Fort Dix Doppler Radar Imagery
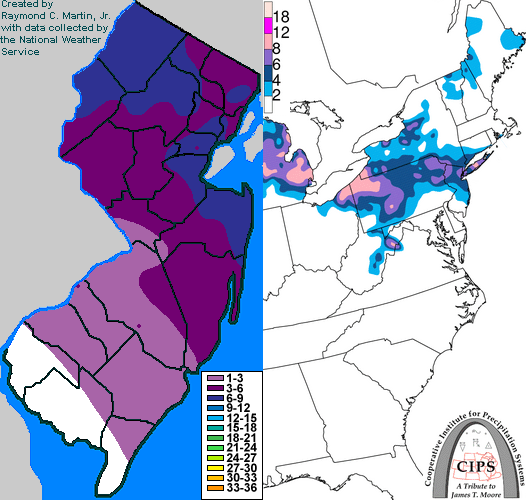
Contoured Snowfall Totals from January 14-15, 2004
STORM DESCRIPTION
An Alberta Clipper low pressure system dropped snow across New Jersey, with the highest amounts in the northeast.
Synoptic Discussion
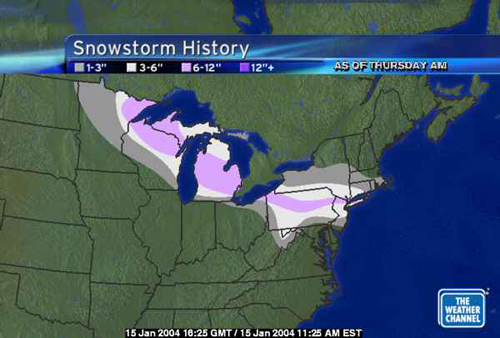
The low pressure system reponsible for the snow moved from Alberta Province, Canada on the morning of the 13th to Wisconsin by the morning of the 14th, to central Ohio during the evening of the 14th, and to Chesepeake Bay by the midnight of the 15th. By late morning of the 15th, it was 300 miles east of the Delmarva Peninsula.
Local Discussion
Snow spread northwest to southeast across the state during the evening of the 14th. The snow was never very heavy, but unusually cold air already in place allowed the snow to accumulate quickly. The axis of heaviest snow was well north of the actual low pressure track and was aligned northwest to southeast across northern New Jersey. Snowfall was aided by an onshore flow which added Atlantic moisture, increasing snowfall amounts in the coastal areas. Further south and west, distance from the upper-level support resulted in a much lighter snowfall. The snow reached its peak in the early morning hours of the 15th, and moved out of the state from northwest to southeast by late morning. Snowfall accumulations generally decreased from northeast to southwest, averaging 6 to 8 inches in Sussex County, 5 to 8 inches in Bergen, Union and Essex counties, 2 to 8 inches in Monmouth County, 5 to 7 inches in Morris, Passaic and Hudson counties, 3 to 7 inches in Warren County, 4 to 6 inches in Middlesex County, 3 to 6 inches in Hunterdon, Somerset and Ocean counties, 2 to 4 inches in Mercer County, 1 to 3 inches in Burlington and Camden counties, 1 to 2 inches in Gloucester and Atlantic counties, and a coating to 1 inch in Salem, Cumberland, and Cape May counties.
New Jersey Snowfall Totals
Individual Snowfall Totals from January 14-15, 2004
Regional Snowfall Totals
Snowfall Totals from 1600Z 15 January 2004 (11AM EST 15 January 2004)
Table of Contents
Storm Summary
Regional Surface Observations
National Weather Service Forecasts
Surface Maps
Satellite Imagery
National Surface Weather Maps - Pressure and Fronts Only
Continental Surface Weather Maps - Pressure and Fronts Only
Sea Level Pressure and 1000 to 500 Millibar Thickness Maps
850 Millibar Maps
700 Millibar Maps
500 Millibar Maps
300 Millibar Maps
200 Millibar Maps
National Radar Imagery
Regional Radar Imagery
Fort Dix Doppler Radar Imagery
Snow and ice storm, December 5-6, 2003
Snow storm, December 14-15, 2003
Snow storm, January 14-15, 2004
Snow and ice storm, January 17-18, 2004
Snow storm, January 26, 2004
Snow and ice storm, January 27-28, 2004
Snow and ice storm, March 16-17, 2004
Snow storm, March 18-19, 2004
Back to Ray's Winter Storm Archive
Copyright © 2012 by Raymond C Martin Jr. All rights reserved