

Storm description, surface observations, snowfall totals, and images courtesy of the National Climatic Data Center, the National Centers of Environmental Prediction, the Climate Prediction Center, the Hydrometeorological Prediction Center, the Mount Holly National Weather Service Office, the Upton National Weather Service Office, Rutgers University, Plymouth State University, the University of Illinois, the American Meteorological Society, Weather Graphics Technologies, AccuWeather, and the Weather Channel.
Table of Contents
Storm Summary
Regional Surface Observations
National Weather Service Forecasts
Surface Maps
Satellite Imagery
Sea Level Pressure and 1000 to 500 Millibar Thickness Maps
850 Millibar Maps
700 Millibar Maps
500 Millibar Maps
300 Millibar Maps
200 Millibar Maps
National Radar Imagery
Local Radar Imagery
Fort Dix Doppler Radar Imagery
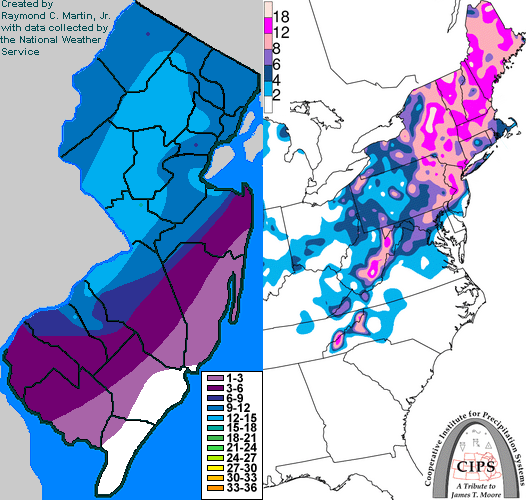
Contoured Snowfall Totals from February 3-4, 1995
STORM DESCRIPTION
A strong nor'easter slammed the state with the only major snowfall of the winter.
Synoptic Discussion
A low pressure developed over Oklahoma on the 2nd and moved into the Lower Tennessee Valley on the morning of the 3rd. At 1900 EST on the 3rd the low was in northeastern Kentucky and it reached West Virginia by 0100 EST on the 4th. At the same time, a second low pressure was forming over central North Carolina. By 0700 EST, double barrelled low pressures were over the Delaware coastal waters and just north of Cape Hatteras. The Delaware coastal low quickly intensified and became the main system as it reached central Long Island on the afternoon of the 4th and Cape Cod later that evening.
Local Discussion
For most of New Jersey, this storm was the heaviest and only major snowfall of the season. Light snow spread across New Jersey during the evening of the 3rd. Heavy snow fell over New Jersey between 0200 and 0900 EST, aided by imbedded thunderstorms. Closer to the coast, the proximity of the storm caused the precipitation to fall mainly as rain. From Atlantic City southwards, no measurable snow fell. In coastal Ocean County, 1 to 2 inches accumulated. In Atlantic, southern Burlington, coastal Ocean and Cumberland Counties, between 1 and 5 inches fell. All areas further north saw between 5 and 13 inches of snow, with the notable exception of Mercer County, which received 12 to 16 inches. The snow changed to rain across most of the state by 9AM EST. Although the rain then changed back to snow during the afternoon, by then precipitation was too light to result in further accumulations.
New Jersey Snowfall Totals
Individual Snowfall Totals from February 3-4, 1995
Regional Snowfall Totals
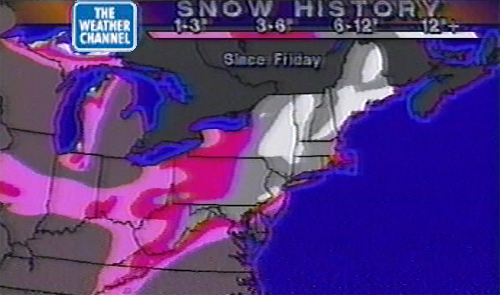
Snowfall Totals from 1700Z 5 February 1995 (12PM EST 5 February 1995)
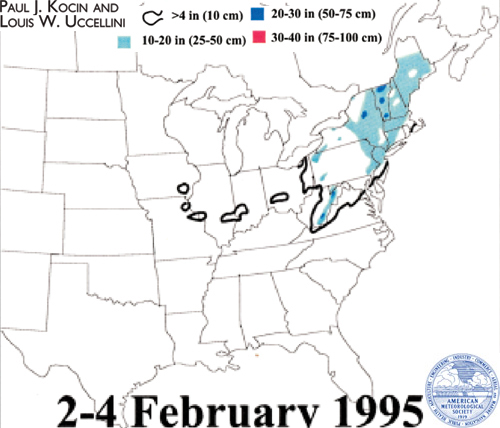
Final Snowfall Totals from February 2-4, 1995
Table of Contents
Storm Summary
Regional Surface Observations
National Weather Service Forecasts
Surface Maps
Satellite Imagery
Sea Level Pressure and 1000 to 500 Millibar Thickness Maps
850 Millibar Maps
700 Millibar Maps
500 Millibar Maps
300 Millibar Maps
200 Millibar Maps
National Radar Imagery
Local Radar Imagery
Fort Dix Doppler Radar Imagery
Snow and ice storm, January 10-11, 1995
Snow storm, February 3-4, 1995
Snow storm, February 26, 1995
Back to Ray's Winter Storm Archive
Copyright © 2012 by Raymond C Martin Jr. All rights reserved