![]() |
![]() |
![]() |
![]() |
![]() |
![]() |
![]() |
![]() |
![]() |
![]() |
![]() |
![]() |
![]() |
![]() |
![]() |
![]() |
|
 |
|
|
 |
|
|
Storm description, surface observations, snowfall totals, and images courtesy of the National Climatic Data Center, the National Centers of Environmental Prediction, the Climate Prediction Center, the Hydrometeorological Prediction Center, the Mount Holly National Weather Service Office, the Upton National Weather Service Office, Rutgers University, Plymouth State University, the University of Illinois, the American Meteorological Society, Weather Graphics Technologies, AccuWeather, and the Weather Channel.
|
|
|
Table of Contents
Storm Summary
Regional Surface Observations
National Weather Service Forecasts
Surface Maps
Satellite Imagery
National Surface Weather Maps - Pressure and Fronts Only
Continental Surface Weather Maps - Pressure and Fronts Only
Sea Level Pressure and 1000 to 500 Millibar Thickness Maps
850 Millibar Maps
700 Millibar Maps
500 Millibar Maps
300 Millibar Maps
200 Millibar Maps
National Radar Imagery
Regional Radar Imagery
Fort Dix Doppler Radar Imagery
Storm Photos
|
|
|
 |
|
|
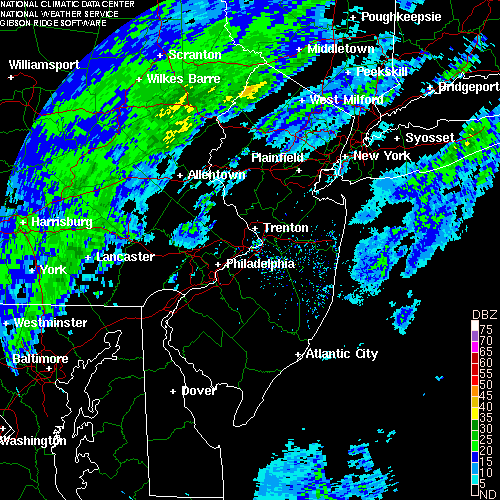
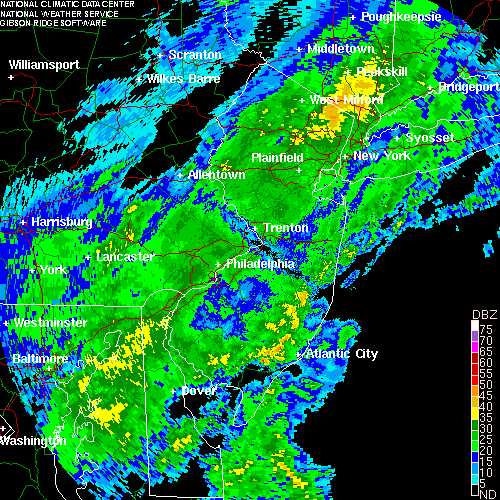
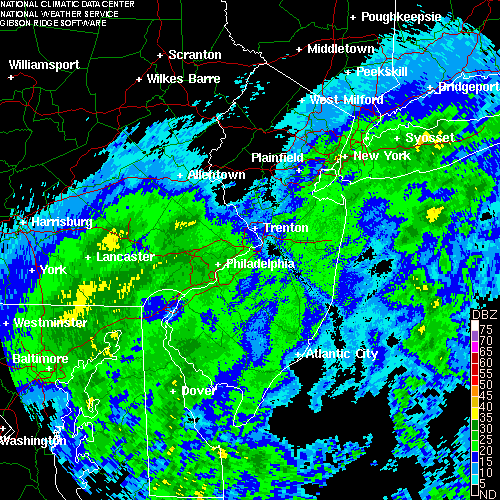
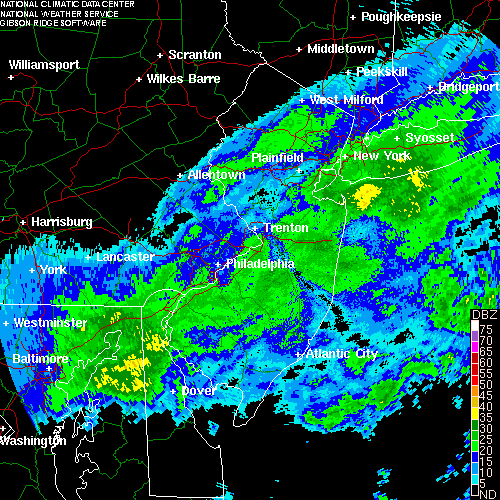
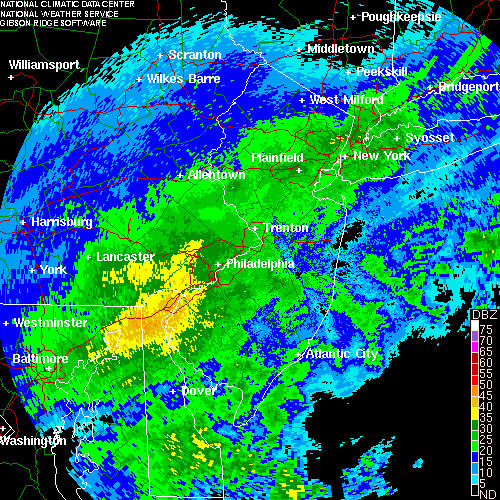
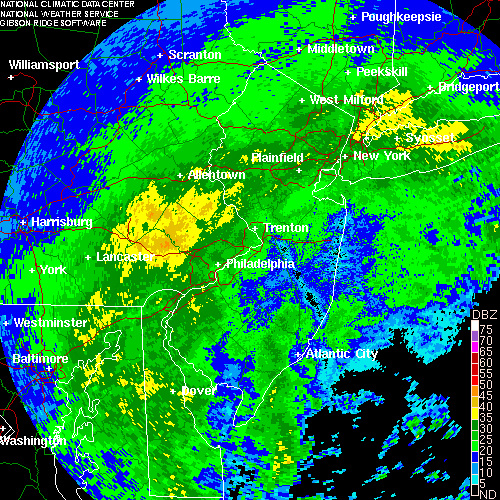
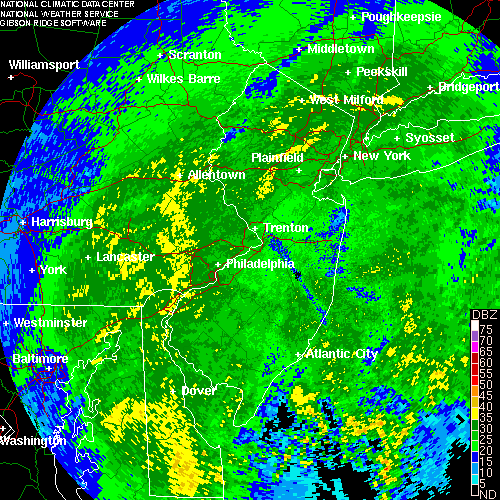
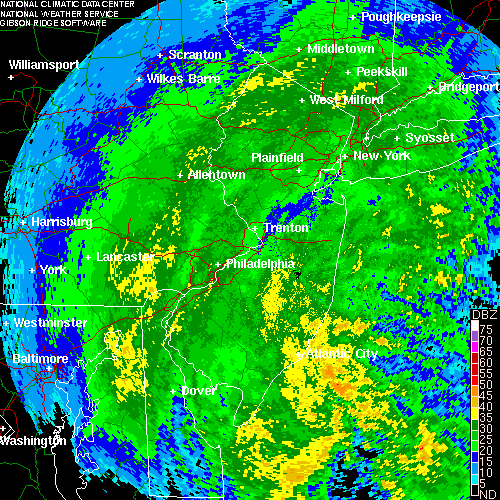
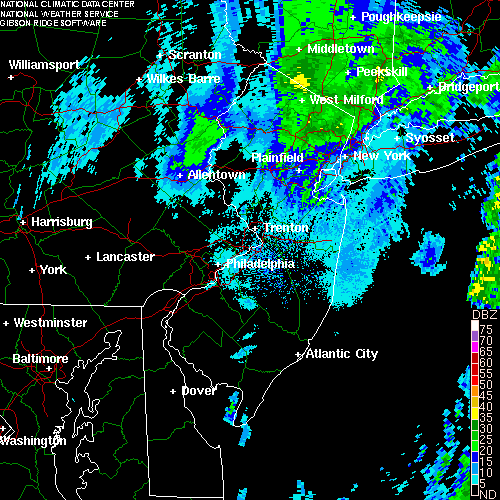
Doppler Radar from 2100Z 15 March 2007 (5PM EDT 15 March 2007)
|
|
|
 |
|
|
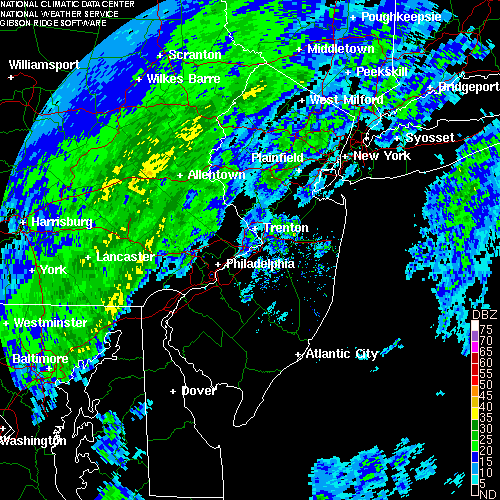
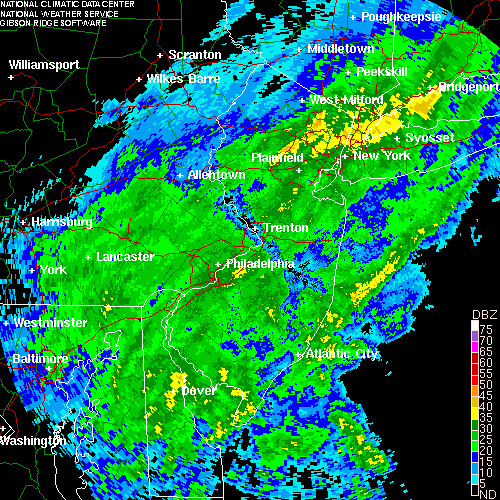
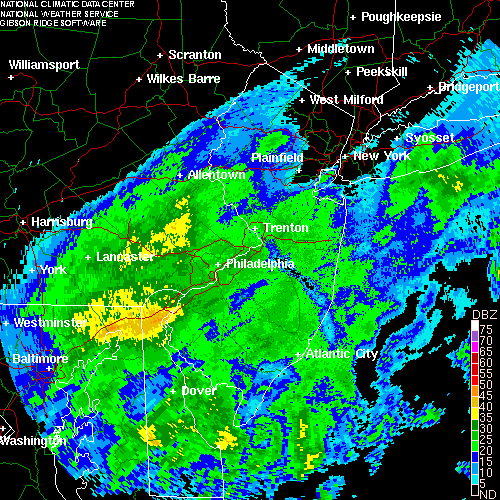
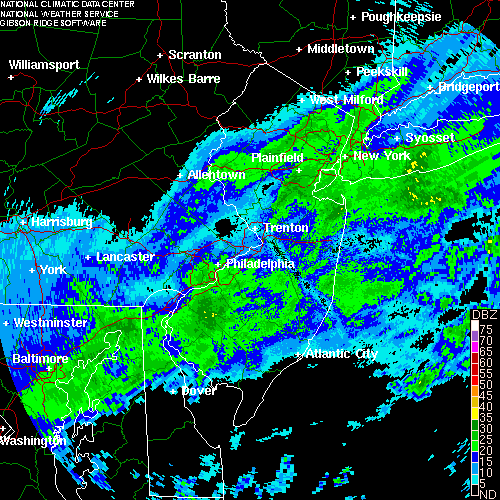
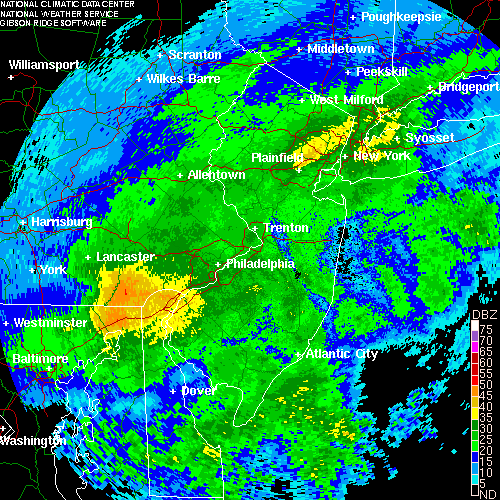
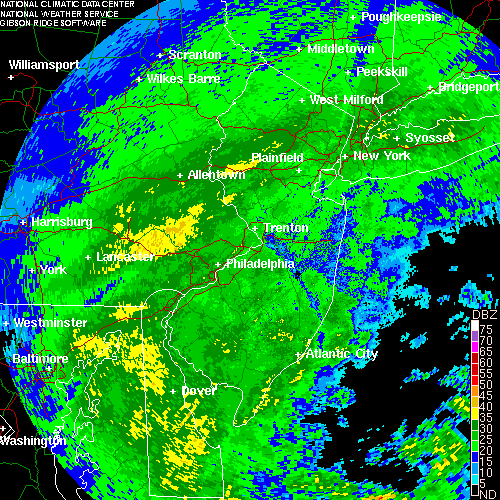
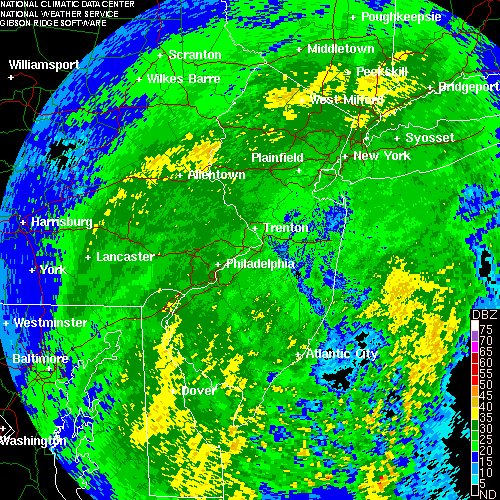
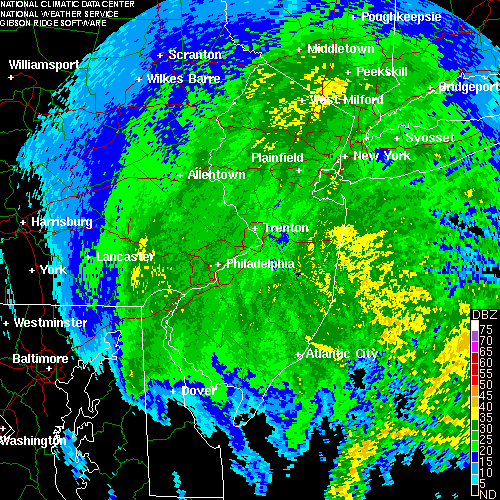
Doppler Radar from 2200Z 15 March 2007 (6PM EDT 15 March 2007)
|
|
|
 |
|
|
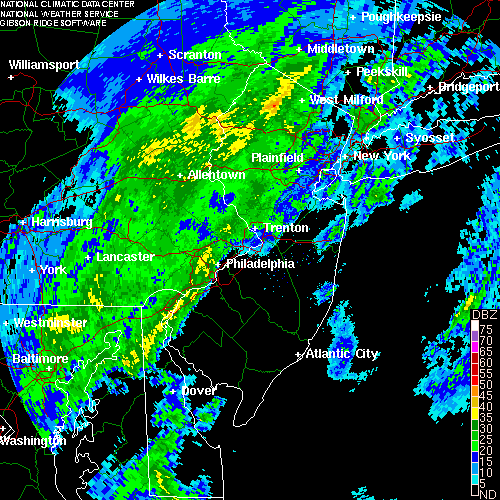
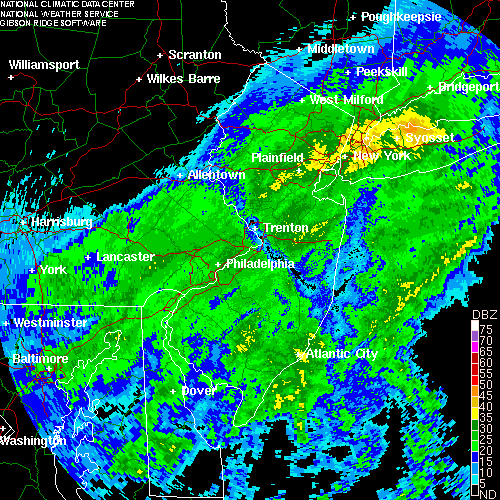
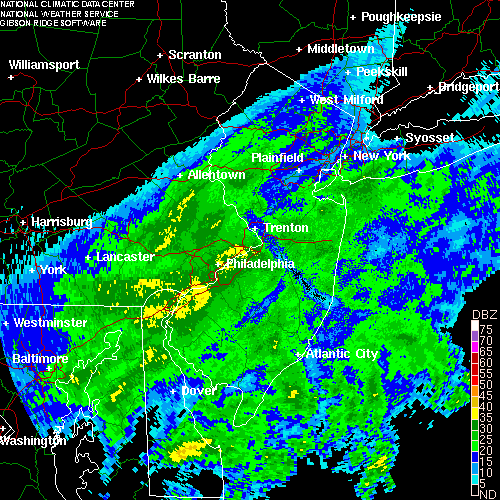
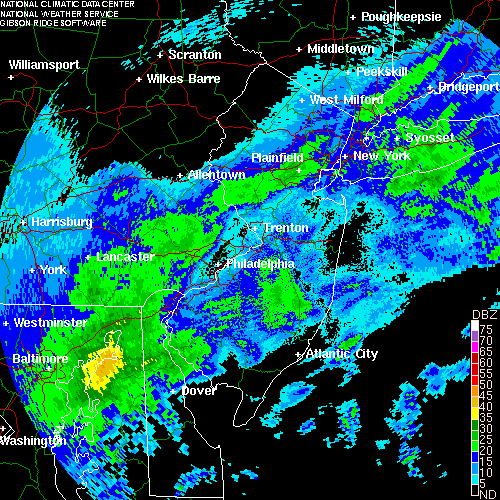
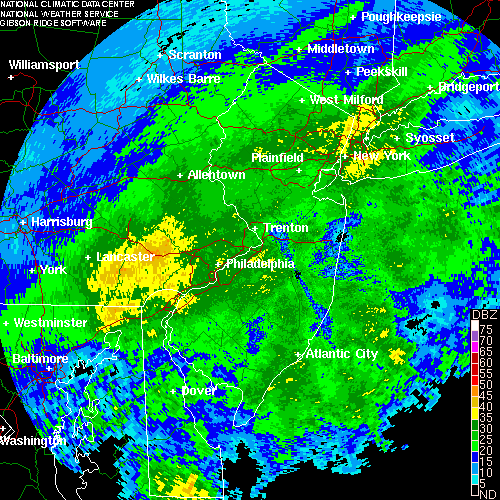
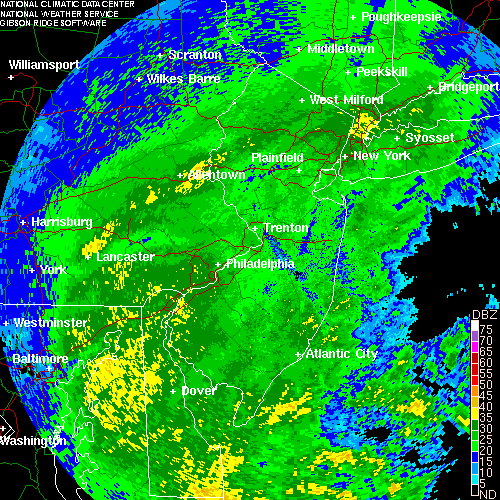
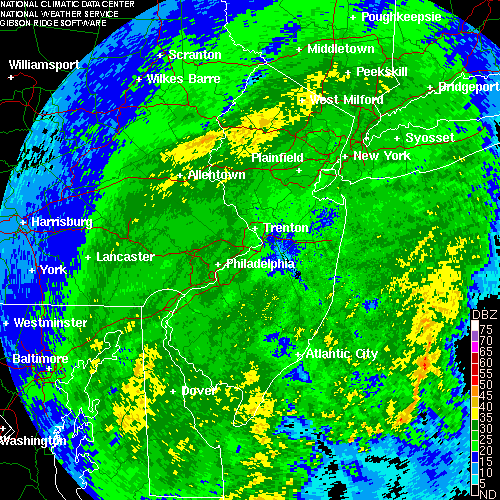
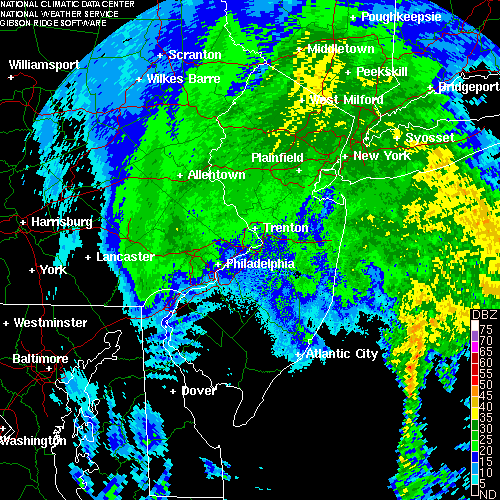
Doppler Radar from 2300Z 15 March 2007 (7PM EDT 15 March 2007)
|
|
|
 |
|
|
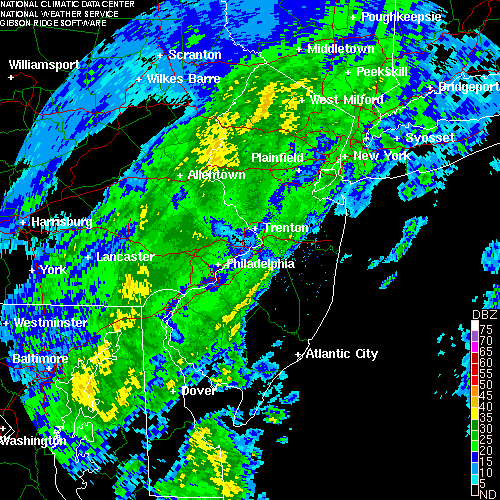
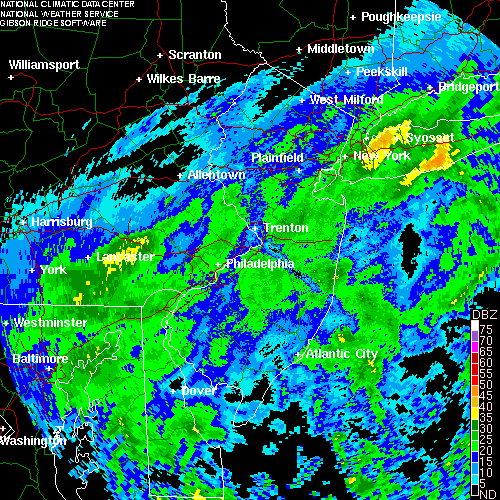
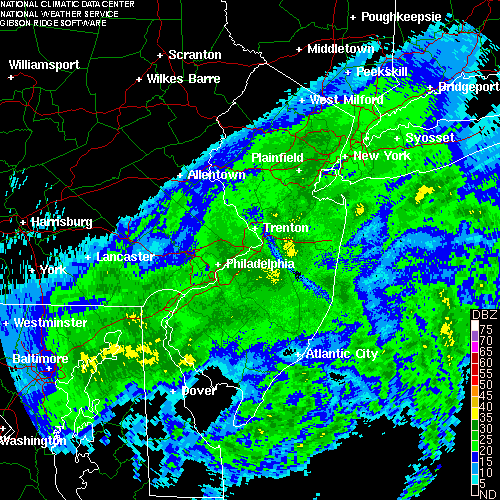
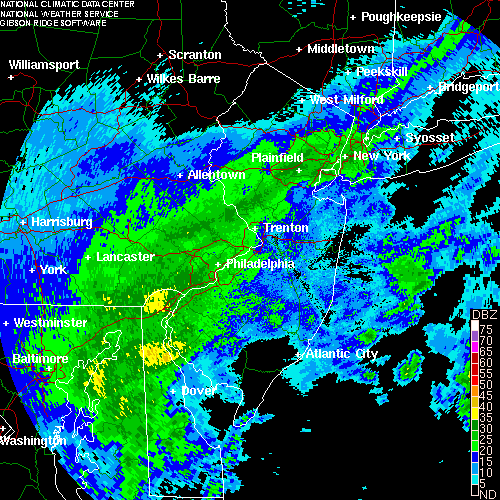
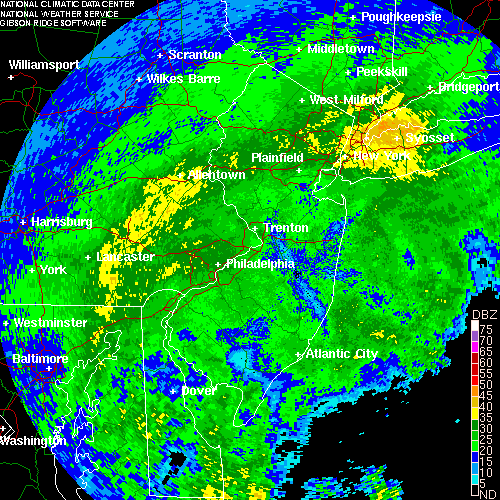
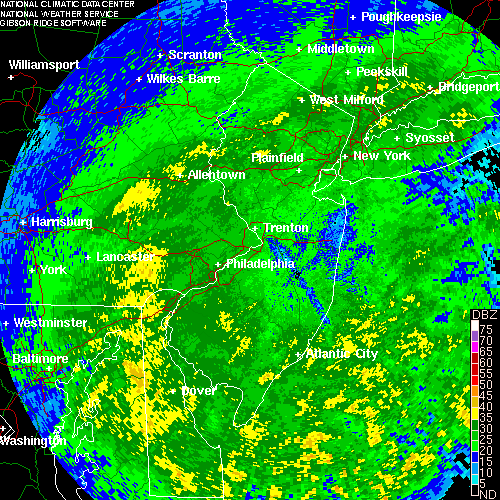
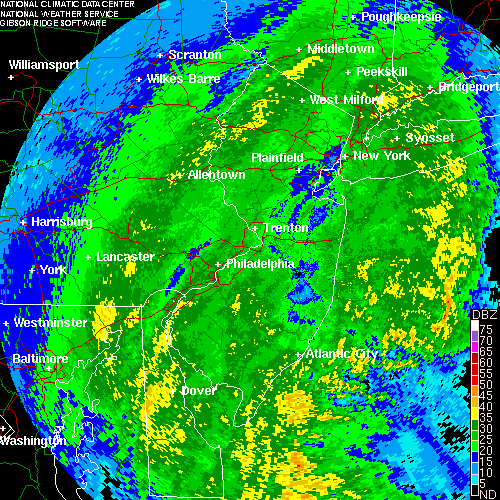
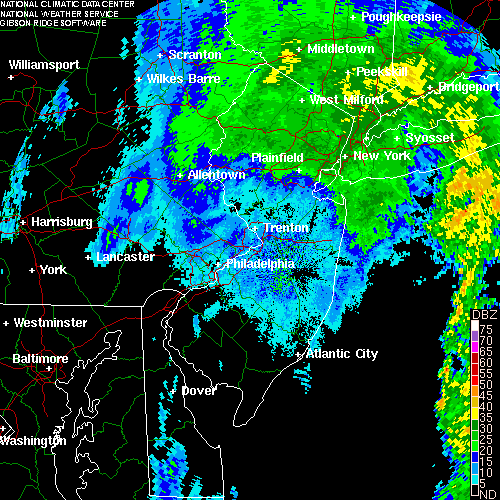
Doppler Radar from 0000Z 16 March 2007 (8PM EDT 15 March 2007)
|
|
|
 |
|
|
Doppler Radar from 0100Z 16 March 2007 (9PM EDT 15 March 2007)
|
|
|
 |
|
|
Doppler Radar from 0200Z 16 March 2007 (10PM EDT 15 March 2007)
|
|
|
 |
|
|
Doppler Radar from 0300Z 16 March 2007 (11PM EDT 15 March 2007)
|
|
|
 |
|
|
Doppler Radar from 0400Z 16 March 2007 (12AM EDT 16 March 2007)
|
|
|
 |
|
|
Doppler Radar from 0500Z 16 March 2007 (1AM EDT 16 March 2007)
|
|
|
 |
|
|
Doppler Radar from 0600Z 16 March 2007 (2AM EDT 16 March 2007)
|
|
|
 |
|
|
Doppler Radar from 0700Z 16 March 2007 (3AM EDT 16 March 2007)
|
|
|
 |
|
|
Doppler Radar from 0800Z 16 March 2007 (4AM EDT 16 March 2007)
|
|
|
 |
|
|
Doppler Radar from 0900Z 16 March 2007 (5AM EDT 16 March 2007)
|
|
|
 |
|
|
Doppler Radar from 1000Z 16 March 2007 (6AM EDT 16 March 2007)
|
|
|
 |
|
|
Doppler Radar from 1100Z 16 March 2007 (7AM EDT 16 March 2007)
|
|
|
 |
|
|
Doppler Radar from 1200Z 16 March 2007 (8AM EDT 16 March 2007)
|
|
|
 |
|
|
Doppler Radar from 1300Z 16 March 2007 (9AM EDT 16 March 2007)
|
|
|
 |
|
|
Doppler Radar from 1400Z 16 March 2007 (10AM EDT 16 March 2007)
|
|
|
 |
|
|
Doppler Radar from 1500Z 16 March 2007 (11AM EDT 16 March 2007)
|
|
|
 |
|
|
Doppler Radar from 1600Z 16 March 2007 (12PM EDT 16 March 2007)
|
|
|
 |
|
|
Doppler Radar from 1700Z 16 March 2007 (1PM EDT 16 March 2007)
|
|
|
 |
|
|
Doppler Radar from 1800Z 16 March 2007 (2PM EDT 16 March 2007)
|
|
|
 |
|
|
Doppler Radar from 1900Z 16 March 2007 (3PM EDT 16 March 2007)
|
|
|
 |
|
|
Doppler Radar from 2000Z 16 March 2007 (4PM EDT 16 March 2007)
|
|
|
 |
|
|
Doppler Radar from 2100Z 16 March 2007 (5PM EDT 16 March 2007)
|
|
|
 |
|
|
Doppler Radar from 2200Z 16 March 2007 (6PM EDT 16 March 2007)
|
|
|
 |
|
|
Doppler Radar from 2300Z 16 March 2007 (7PM EDT 16 March 2007)
|
|
|
 |
|
|
Doppler Radar from 0000Z 17 March 2007 (8PM EDT 16 March 2007)
|
|
|
 |
|
|
Doppler Radar from 0100Z 17 March 2007 (9PM EDT 16 March 2007)
|
|
|
 |
|
|
Doppler Radar from 0200Z 17 March 2007 (10PM EDT 16 March 2007)
|
|
|
 |
|
|
Doppler Radar from 0300Z 17 March 2007 (11PM EDT 16 March 2007)
|
|
|
 |
|
|
Doppler Radar from 0400Z 17 March 2007 (12AM EDT 16 March 2007)
|
|
|
 |
|
|
Doppler Radar from 0400Z 17 March 2007 (12AM EDT 16 March 2007)
|
|
|
Table of Contents
Storm Summary
Regional Surface Observations
National Weather Service Forecasts
Surface Maps
Satellite Imagery
National Surface Weather Maps - Pressure and Fronts Only
Continental Surface Weather Maps - Pressure and Fronts Only
Sea Level Pressure and 1000 to 500 Millibar Thickness Maps
850 Millibar Maps
700 Millibar Maps
500 Millibar Maps
300 Millibar Maps
200 Millibar Maps
National Radar Imagery
Regional Radar Imagery
Fort Dix Doppler Radar Imagery
Storm Photos
|
|
|
Snow storm, January 28-29, 2007
Snow and ice storm, February 13-14, 2007
Snow and ice storm, February 25-26, 2007
Snow storm, March 7, 2007
Ice storm, March 15-17, 2007
Back to Ray's Winter Storm Archive |
|
|
Copyright © 2007 by Raymond C Martin Jr. All rights reserved |
|