

Storm description, surface observations, snowfall totals, and images courtesy of the National Climatic Data Center, the National Centers of Environmental Prediction, the Climate Prediction Center, the Hydrometeorological Prediction Center, the Mount Holly National Weather Service Office, the Upton National Weather Service Office, Rutgers University, Plymouth State University, the University of Illinois, the American Meteorological Society, Weather Graphics Technologies, AccuWeather, and the Weather Channel.
Table of Contents
Storm Summary
Regional Surface Observations
National Weather Service Forecasts
Surface Maps
Satellite Imagery
National Surface Weather Maps - Pressure and Fronts Only
Continental Surface Weather Maps - Pressure and Fronts Only
Sea Level Pressure and 1000 to 500 Millibar Thickness Maps
850 Millibar Maps
700 Millibar Maps
500 Millibar Maps
300 Millibar Maps
200 Millibar Maps
National Radar Imagery
Regional Radar Imagery
Fort Dix Doppler Radar Imagery
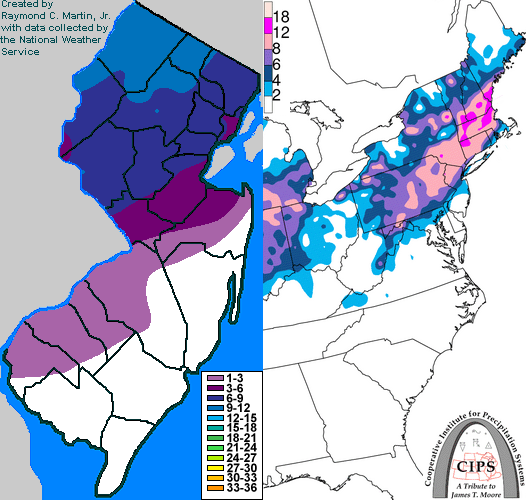
Contoured Snowfall Totals from December 9, 2005
STORM DESCRIPTION
A very quick moving but potent storm system brought the third, and most significant, snowfall to much of New Jersey in less than a week. Significant amounts of freezing rain also affected southern parts of the state.
Synoptic Discussion
A vigorous upper-level low pressure moved across the Midwest on Thursday December 8th, tapping a significant supply of moisture from the Gulf of Mexico. Two surface lows were associated with the storm system: one near the upper-level low in the Midwest, and another associated with low-level warm advection near the Gulf Coast. As the storm system moved toward the Northeast, a new surface low pressure formed on a developing coastal front near the Delmarva on the morning of Friday December 9th. This low pressure became the primary surface low and rapidly intensified as it headed east-northeastward away from New Jersey on the afternoon of the 9th, reaching Newfoundland on the morning of Saturday December 10th. The rapid intensification (36 millibars in 24 hours) of the Delmarva low allowed heavy snow and ice to fall across much of New Jersey, despite the brief time span the storm system spent over the state.
Local Discussion
Precipitation overspread New Jersey from west to east between 2 AM EST and 5 AM EST on Friday December 9th and quickly became heavy at times. Across Sussex, Warren, Morris, Bergen, Passaic, Hunterdon and Somerset counties, precipitation fell entirely in the form of snow. Across Mercer, Middlesex, Union, Essex and Hudson counties, precipitation began as snow, but changed to sleet and freezing rain between 8 AM EST and 10 AM EST as warm air moved in aloft. Across Salem, Gloucester, Camden, northwestern Burlington and Monmouth counties, precipitation began as snow but quickly mixed with sleet and freezing rain. Here, precipitation type was intensity driven, with the heaviest bands falling in the form of snow, but lighter precipitation changing to sleet and freezing rain. Across Cumberland, northwestern Atlantic, southwestern Burlington and northwestern Ocean counties, precipitation fell primarily in the form of freezing rain, with some mixing with sleet and plain rain at times. Across southeastern Ocean, southeastern Atlantic and all of Cape May County, precipitation fell primarily in the form of rain as low-level warm air moved inland from the ocean. Precipitation tapered off state-wide between 9AM EST and 12 PM EST. Snowfall accumulations ranged from 8 to 13 inches in Sussex County, 5 to 12 inches in Warren County, 7 to 11 inches in Passaic County, 6 to 10 inches in Morris County, 4 to 10 inches in Hunterdon County, 6 to 9 inches in Somerset and Essex counties, 5 to 9 inches in Bergen County, 6 to 7 inches in Union County, 5 to 7 inches in Hudson County, 3 to 7 inches in Mercer and Middlesex counties, a coating to 4 inches in Monmouth County, a coating to 3 inches in Burlington County, a coating to 2 inches in Camden, Gloucester and Salem Counties, and a coating or less across Ocean, Atlantic, Cumberland and Cape May counties. Ice accretions ranged between one tenth and four tenths of an inch across southern and central New Jersey, with the highest amounts in Cumberland and Burlington counties.
New Jersey Snowfall Totals
Individual Snowfall Totals from December 9, 2005
Table of Contents
Storm Summary
Regional Surface Observations
National Weather Service Forecasts
Surface Maps
Satellite Imagery
National Surface Weather Maps - Pressure and Fronts Only
Continental Surface Weather Maps - Pressure and Fronts Only
Sea Level Pressure and 1000 to 500 Millibar Thickness Maps
850 Millibar Maps
700 Millibar Maps
500 Millibar Maps
300 Millibar Maps
200 Millibar Maps
National Radar Imagery
Regional Radar Imagery
Fort Dix Doppler Radar Imagery
Snow and ice storm, December 4, 2005
Snow storm, December 5-6, 2005
Snow and ice storm, December 9, 2005
Snow storm, January 14-15, 2006
Snow storm, February 11-12, 2006
Back to Ray's Winter Storm Archive
Copyright © 2012 by Raymond C Martin Jr. All rights reserved