

Storm description, surface observations, snowfall totals, and images courtesy of the National Climatic Data Center, the National Centers of Environmental Prediction, the Climate Prediction Center, the Hydrometeorological Prediction Center, the Mount Holly National Weather Service Office, the Upton National Weather Service Office, Rutgers University, Plymouth State University, the University of Illinois, the American Meteorological Society, Weather Graphics Technologies, AccuWeather, and the Weather Channel.
Table of Contents
Storm Summary
Regional Surface Observations
National Weather Service Forecasts
Surface Maps
Satellite Imagery
National Surface Weather Maps - Pressure and Fronts Only
Continental Surface Weather Maps - Pressure and Fronts Only
Sea Level Pressure and 1000 to 500 Millibar Thickness Maps
850 Millibar Maps
700 Millibar Maps
500 Millibar Maps
300 Millibar Maps
200 Millibar Maps
National Radar Imagery
Regional Radar Imagery
Fort Dix Doppler Radar Imagery
Storm Photos
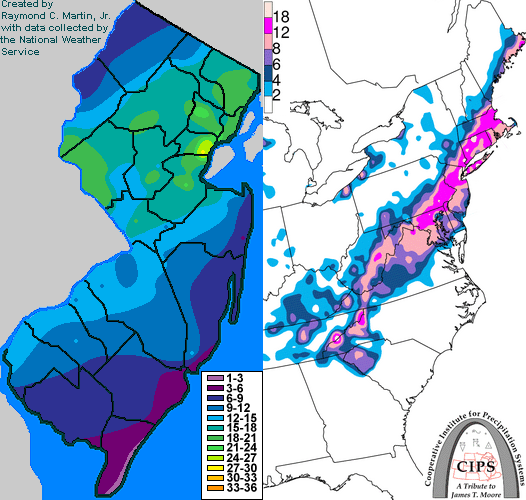
Contoured Snowfall Totals from February 11-12, 2006
STORM DESCRIPTION
The "Blizzard of 2006" paralyzed much of New Jersey, dropping between 2 and 27 inches of snow across the state. The heaviest accumulations were concentrated in west-central and northeastern parts of the state. Lightning, thunder and strong winds also accompanied the storm.
Synoptic Discussion
A low pressure system developed along the Gulf Coast on Friday, February 10th. By Saturday, February 11th, it was moving northeastward along the Southeast coast. During the night of the 11th, the storm strengthened rapidly as it moved northeastward off the New Jersey coast. By the late afternoon of Sunday, February 12th, the storm was east of Cape Cod and continuing to move northeastward.
Local Discussion
Precipitation overspread New Jersey slowly from south to north during the afternoon of Saturday February 11th, beginning in Cape May County at 12 PM EST but not reaching Sussex County until 7 PM EST. Temperatures in southeastern New Jersey were well above freezing, causing precipitation to begin in the form of rain. Further north, temperatures were cold enough for the precipitation to start in the form of snow, but only in far northwestern parts of the state were temperatures below freezing when precipitation commenced. Intensity of the precipitation increased gradually during the evening and then more quickly during the overnight hours. Thunder and lightning also occurred from after midnight until just after dawn. Precipitation remained in the form of snow across northern, central and southwestern New Jersey, and gradually changed to snow in southeastern New Jersey as the deepening low pressure system pulled colder air southward across the state. As temperatures fell well into the 20s, the wind picked up and gusted to over 40 mph in many areas, resulting in near-blizzard conditions. The heaviest snow band moved across the state from west to east during the hours just before and after dawn on Sunday February 12th, with snow accumulation rates exceeding 4 inches per hour for a time in many areas. As the low pressure pulled away to the east during the afternoon of Sunday February 12th, the snow gradually ended from west to east between 1PM and 5PM EST. Accumulations ranged from 16 to 27 inches in Union County, 17 to 22 inches in Essex County, 17 to 21 inches in Hudson County, 15 to 21 inches in Middlesex County, 16 to 20 inches in Bergen County, 13 to 19 inches in Morris and Somerset counties, 9 to 19 inches in Mercer County, 12 to 18 inches in Hunterdon County, 9 to 18 inches in Passaic County, 7 to 18 inches in Warren County, 5 to 16 inches in Monmouth County, 10 to 14 inches in Burlington and Gloucester counties, 9 to 13 inches in Camden and Salem counties, 8 to 12 inches in Sussex County, 4 to 12 inches in Ocean County, 4 to 9 inches in Atlantic and Cumberland counties, and 2 to 5 inches in Cape May County.
New Jersey Snowfall Totals
Individual Snowfall Totals from February 11-12, 2006
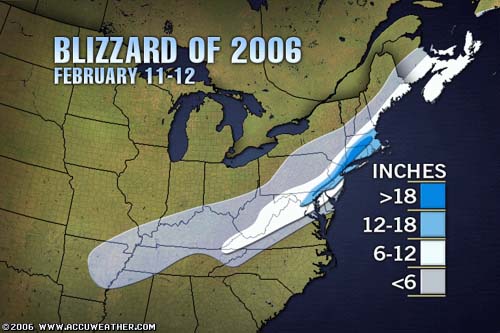
Regional Snowfall Totals
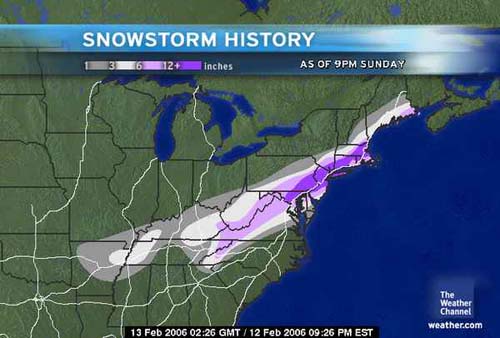
Snow Totals from 0200Z 13 February 2006 (9PM EST 12 February 2006)
Snow Totals from 0000Z 13 February 2006 (7PM EST 12 February 2006)
Table of Contents
Storm Summary
Regional Surface Observations
National Weather Service Forecasts
Surface Maps
Satellite Imagery
National Surface Weather Maps - Pressure and Fronts Only
Continental Surface Weather Maps - Pressure and Fronts Only
Sea Level Pressure and 1000 to 500 Millibar Thickness Maps
850 Millibar Maps
700 Millibar Maps
500 Millibar Maps
300 Millibar Maps
200 Millibar Maps
National Radar Imagery
Regional Radar Imagery
Fort Dix Doppler Radar Imagery
Storm Photos
Snow and ice storm, December 4, 2005
Snow storm, December 5-6, 2005
Snow and ice storm, December 9, 2005
Snow storm, January 14-15, 2006
Snow storm, February 11-12, 2006
Back to Ray's Winter Storm Archive
Copyright © 2012 by Raymond C Martin Jr. All rights reserved