

Storm description, surface observations, snowfall totals, and images courtesy of the National Climatic Data Center, the National Centers of Environmental Prediction, the Climate Prediction Center, the Hydrometeorological Prediction Center, the Mount Holly National Weather Service Office, the Upton National Weather Service Office, Rutgers University, Plymouth State University, the University of Illinois, the American Meteorological Society, Weather Graphics Technologies, AccuWeather, and the Weather Channel.
Table of Contents
Storm Summary
Regional Surface Observations
National Weather Service Forecasts
Surface Maps
Satellite Imagery
National Surface Weather Maps - Pressure and Fronts Only
Continental Surface Weather Maps - Pressure and Fronts Only
Sea Level Pressure and 1000 to 500 Millibar Thickness Maps
850 Millibar Maps
700 Millibar Maps
500 Millibar Maps
300 Millibar Maps
200 Millibar Maps
National Radar Imagery
Regional Radar Imagery
Fort Dix Doppler Radar Imagery
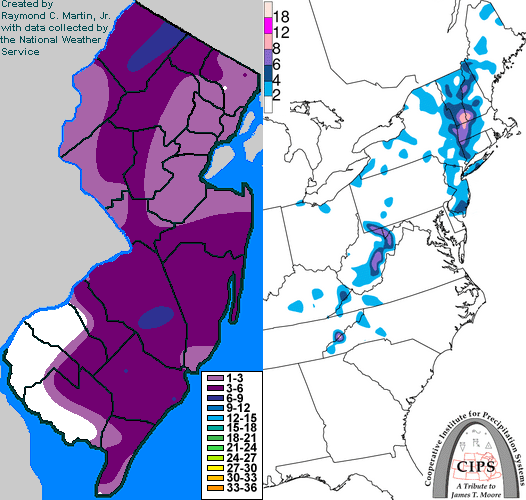
Contoured Snowfall Totals from January 14-15, 2006
STORM DESCRIPTION
A rapidly strengthening low pressure system brought locally heavy snow and near-blizzard conditions to parts of New Jersey, with lighter snow falling across the rest of the state.
Synoptic Discussion
A warm front moved northward across the state during the overnight hours of Friday January 13th. A cold front then moved eastward across the state during the morning hours of Saturday, January 14th. A second cold front moved through during the late afternoon hours of the 14th. A low pressure system accompanying the second front also moved across the state during the afternoon, and strengthened during the evening as it moved off the coast. The storm system continued moving eastward overnight and was near Cape Cod by the morning of Sunday, January 15th.
Local Discussion
Showers and thunderstorms developed across much of the state during the early morning hours of Saturday January 14th behind the warm front and ahead of the first cold front. A squall line accompanied the actual cold front as it passed across the state near dawn on the 14th, resulting in a few reports of wind damage. Temperatures in the upper 50s and lower 60s before the front passed fell into the 50s after the front passed. During the afternoon, showers and thunderstorms redeveloped across the state as the low pressure and second cold front advanced into the state from the west. As the low pressure and second front moved offshore late in the afternoon, the approaching mid- and upper-level disturbances caused a new band of precipitation to develop across most of New Jersey. Precipitation from this band was initially in the form of rain, but as cold air poured across the state behind the second cold front, the rain changed to sleet and then to snow during the evening as temperatures fell below freezing. As the low pressure off the coast intensified, snow and blowing snow created near-blizzard conditions across parts of northwestern and southeastern New Jersey, with thunder and lightning also being reported. The snow gradually tapered off toward dawn on Sunday the 15th as the low pressure system moved eastward toward Cape Cod. Snowfall accumulations were highly varried, depending significantly on the orientation and persistence of the main snow band associated with the mid- and upper-level disturbances. Final snowfall totals ranged from 2 to 8 inches in Burlington County, 4 to 7 inches in Atlantic County, 3 to 6 inches in Sussex County, 2 to 6 inches in Morris County, 1 to 6 inches in Ocean County, 2 to 5 inches in Passaic County, 1 to 5 inches in Cape May County, 2 to 4 inches in Mercer and Monmouth counties, a coating to 4 inches in Bergen, Hunterdon, Somerset, Camden and Gloucester counties, a coating to 3 inches in Essex and Cumberland counties, and a coating to 2 inches in Hudson, Union, Middlesex, Warren and Salem counties.
New Jersey Snowfall Totals
Individual Snowfall Totals from January 14-15, 2006
Table of Contents
Storm Summary
Regional Surface Observations
National Weather Service Forecasts
Surface Maps
Satellite Imagery
National Surface Weather Maps - Pressure and Fronts Only
Continental Surface Weather Maps - Pressure and Fronts Only
Sea Level Pressure and 1000 to 500 Millibar Thickness Maps
850 Millibar Maps
700 Millibar Maps
500 Millibar Maps
300 Millibar Maps
200 Millibar Maps
National Radar Imagery
Regional Radar Imagery
Fort Dix Doppler Radar Imagery
Snow and ice storm, December 4, 2005
Snow storm, December 5-6, 2005
Snow and ice storm, December 9, 2005
Snow storm, January 14-15, 2006
Snow storm, February 11-12, 2006
Back to Ray's Winter Storm Archive
Copyright © 2012 by Raymond C Martin Jr. All rights reserved