

Storm description, surface observations, snowfall totals, and images courtesy of the National Climatic Data Center, the National Centers of Environmental Prediction, the Climate Prediction Center, the Hydrometeorological Prediction Center, the Mount Holly National Weather Service Office, the Upton National Weather Service Office, Rutgers University, Plymouth State University, the University of Illinois, the American Meteorological Society, Weather Graphics Technologies, AccuWeather, and the Weather Channel.
Table of Contents
Storm Summary
Regional Surface Observations
National Weather Service Forecasts
Surface Maps
Satellite Imagery
National Surface Weather Maps - Pressure and Fronts Only
Continental Surface Weather Maps - Pressure and Fronts Only
Sea Level Pressure and 1000 to 500 Millibar Thickness Maps
850 Millibar Maps
700 Millibar Maps
500 Millibar Maps
300 Millibar Maps
200 Millibar Maps
National Radar Imagery
Regional Radar Imagery
Fort Dix Doppler Radar Imagery
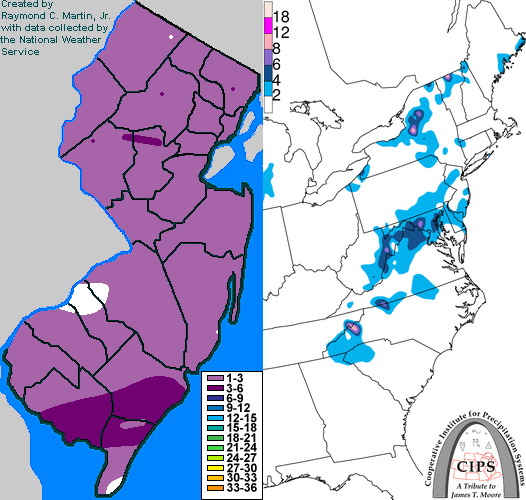
Contoured Snowfall Totals from February 2-3, 2010
STORM DESCRIPTION
A pair of low pressure systems brought light snow to New Jersey.
Synoptic Discussion
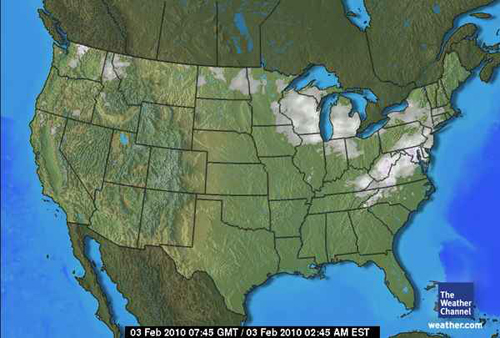
A weakening cold front moved across New Jersey on February 1st. Along the western portion of this front, which had become stationary, a low pressure developed in Wyoming and began moving east. By the early morning of February 2nd, this low was in Iowa. Meanwhile, another low began to develop in the eastern Gulf of Mexico and began to move northeastward. By the evening of February 2nd, the low from Wyoming was over Lake Michigan while the low from the gulf was off the Carolina coast. By the early morning of the 3rd, the low from Wyoming was over Pennsylvania and was dissipating, while the low from the gulf was well east of Cape Hatteras.
Local Discussion
Snow overspread New Jersey from southwest to northeast during the late evening of February 2nd. The snow remained fairly light in intensity and gradually ended from west to east during the predawn hours of February 3rd. The highest accumulations were in southern and northern New Jersey, with lower totals across central New Jersey. Totals ranged from 1 to 4 inches in Bergen, Cape May, Cumberland and Hunterdon counties, 2 to 3 inches in Morris County, 1 to 3 inches in Atlantic, Essex, Hudson, Ocean, Passaic, Somerset, Union and Warren counties, 1 to 2 inches in Burlington, Mercer, Middlesex, Monmouth and Sussex counties, and around 1 inch in Camden, Gloucester and Salem counties.
New Jersey Snowfall Totals
Individual Snowfall Totals from February 2-3, 2010
Regional Snowfall Totals
Snowfall Totals from February 2-3, 2010
Table of Contents
Storm Summary
Regional Surface Observations
National Weather Service Forecasts
Surface Maps
Satellite Imagery
National Surface Weather Maps - Pressure and Fronts Only
Continental Surface Weather Maps - Pressure and Fronts Only
Sea Level Pressure and 1000 to 500 Millibar Thickness Maps
850 Millibar Maps
700 Millibar Maps
500 Millibar Maps
300 Millibar Maps
200 Millibar Maps
National Radar Imagery
Regional Radar Imagery
Fort Dix Doppler Radar Imagery
Snow storm, December 5, 2009
Snow storm, December 19-20, 2009
Snow storm, December 31, 2009
Snow storm, February 2-3, 2010
Snow storm, February 5-6, 2010
Snow storm, February 9-11, 2010
Snow storm, February 15-16, 2010
Snow storm, February 25-26, 2010
Back to Ray's Winter Storm Archive
Copyright © 2012 by Raymond C Martin Jr. All rights reserved