

Storm description, surface observations, snowfall totals, and images courtesy of the National Climatic Data Center, the National Centers of Environmental Prediction, the Climate Prediction Center, the Hydrometeorological Prediction Center, the Mount Holly National Weather Service Office, the Upton National Weather Service Office, Rutgers University, Plymouth State University, the University of Illinois, the American Meteorological Society, Weather Graphics Technologies, AccuWeather, and the Weather Channel.
Table of Contents
Storm Summary
Regional Surface Observations
National Weather Service Forecasts
Surface Maps
Satellite Imagery
National Surface Weather Maps - Pressure and Fronts Only
Continental Surface Weather Maps - Pressure and Fronts Only
Sea Level Pressure and 1000 to 500 Millibar Thickness Maps
850 Millibar Maps
700 Millibar Maps
500 Millibar Maps
300 Millibar Maps
200 Millibar Maps
National Radar Imagery
Regional Radar Imagery
Fort Dix Doppler Radar Imagery
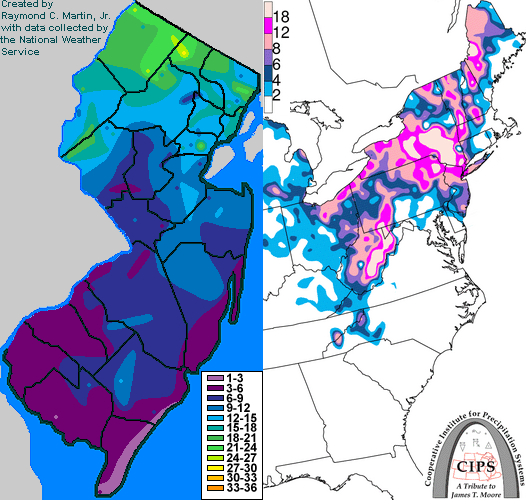
Contoured Snowfall Totals from February 25-26, 2010
STORM DESCRIPTION
The third powerful nor'easter of the month brought the fourth major snowfall of the winter to New Jersey. Unlike the three major snowstorms which preceeded this one, the heaviest snow with this storm fell across the northern third of the state. This was the final accumulating snowfall of the winter in most of the state.
Synoptic Discussion
The primary low pressure system which evolved into this storm developed in the western Gulf of Mexico during the night of February 23rd. However, some additional energy came from a northern system which entered Minnesota from Canada on the night of the 22nd. By the night of the 23rd, this northern system was over Lake Michigan, and by the night of the 24th, it had reached Lake Erie. Meanwhile, the primary low had moved across Florida and was located east of Georgia by the night of the 24th. By the morning of the 25th the northern system had begun to merge with the primary low, which was east of the Outer Banks of North Carolina. By the evening of the 25th, the primary low had strengthened very rapidly and was located just south of Cape Cod. By the morning of the 26th, the primary low was starting to weaken and had actually moved westward to a position directly over New York City. It continued to weaken through the rest of the day on the 26th while remaining nearly stationary. The low remained in the same area while slowly weakening through the day on the 27th before gradually dissipating on the 28th.
Local Discussion
Precipitation overspread the state from south to north late during the night of February 24th. Temperatures were in the mid to upper 30s at the onset, so it began as rain nearly everywhere except for the higher terrain of northwestern New Jersey. As temperatures gradually cooled, the rain slowly changed to snow in most places before dawn on the 25th. However, temperatures remained near freezing through the first portion of the storm. Heavier precipitation, mainly in the form of wet snow, fell across eastern and northern New Jersey through the morning of the 25th before becoming lighter during the afternoon. Further south and west, the wet snow was not as heavy and completely ended during the early afternoon hours. By late in the afternoon and evening, bands of snow began to wrap back toward the southwest as the storm began to retrograde westward. Moderate to occasionally heavy snow fell across much of the state except for the far south during the night of the 25th into the morning of the 26th, which was accompanied by very strong and gusty winds; this resulted in blizzard and near-blizzard conditions across northern and parts of central New Jersey. Precipitation began to fall apart during the morning of the 26th as the storm started to weaken, with only scattered snow showers remaining over the region by the late afternoon. Unlike the previous heavy snowstorms of the Winter of 2009-2010, this storm produced its largest accumulations across northern New Jersey where temperatures were a bit colder and precipitation was much heavier, with lesser accumulations in the south. It should be noted that reports varied widely due to the multiple parts of the storm, relatively mild temperatures during the first part of the storm, and gusty winds during the second part of the storm, all of which made measuring the snow very difficult. Totals ranged from 9 to 28 inches in Morris, Passaic and Sussex counties, 10 to 21 inches in Bergen, Essex, Hudson, Union and Warren counties, 4 to 20 inches in Hunterdon County, 3 to 14 inches in Atlantic, Burlington, Mercer, Middlesex, Monmouth, Ocean, and Somerset counties, 2 to 10 inches in Camden, Cumberland, Gloucester and Salem counties, and 1 to 4 inches in Cape May County.
New Jersey Snowfall Totals
Individual Snowfall Totals from February 25-26, 2010
Regional Snowfall Totals
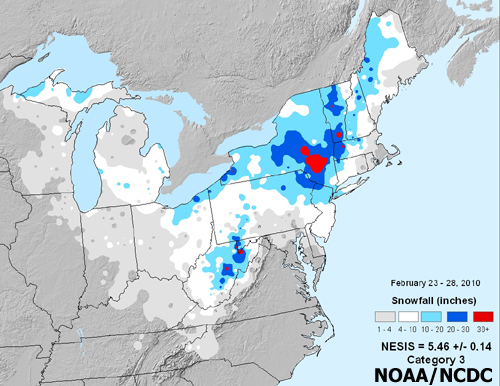
Snowfall Totals from February 25-26, 2010
Table of Contents
Storm Summary
Regional Surface Observations
National Weather Service Forecasts
Surface Maps
Satellite Imagery
National Surface Weather Maps - Pressure and Fronts Only
Continental Surface Weather Maps - Pressure and Fronts Only
Sea Level Pressure and 1000 to 500 Millibar Thickness Maps
850 Millibar Maps
700 Millibar Maps
500 Millibar Maps
300 Millibar Maps
200 Millibar Maps
National Radar Imagery
Regional Radar Imagery
Fort Dix Doppler Radar Imagery
Snow storm, December 5, 2009
Snow storm, December 19-20, 2009
Snow storm, December 31, 2009
Snow storm, February 2-3, 2010
Snow storm, February 5-6, 2010
Snow storm, February 9-11, 2010
Snow storm, February 15-16, 2010
Snow storm, February 25-26, 2010
Back to Ray's Winter Storm Archive
Copyright © 2012 by Raymond C Martin Jr. All rights reserved