

Storm description, surface observations, snowfall totals, and images courtesy of the National Climatic Data Center, the National Centers of Environmental Prediction, the Climate Prediction Center, the Hydrometeorological Prediction Center, the Mount Holly National Weather Service Office, the Upton National Weather Service Office, Rutgers University, Plymouth State University, the University of Illinois, the American Meteorological Society, Weather Graphics Technologies, AccuWeather, and the Weather Channel.
Table of Contents
Storm Summary
Regional Surface Observations
National Weather Service Forecasts
Surface Maps
Satellite Imagery
National Surface Weather Maps - Pressure and Fronts Only
Continental Surface Weather Maps - Pressure and Fronts Only
Sea Level Pressure and 1000 to 500 Millibar Thickness Maps
850 Millibar Maps
700 Millibar Maps
500 Millibar Maps
300 Millibar Maps
200 Millibar Maps
National Radar Imagery
Regional Radar Imagery
Fort Dix Doppler Radar Imagery
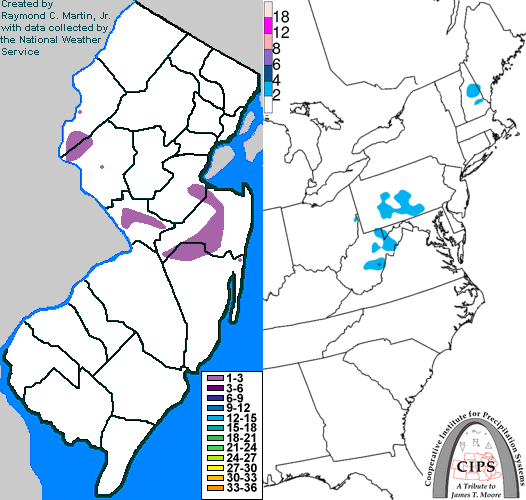
Contoured Snowfall Totals from February 8, 2012
STORM DESCRIPTION
A weak low pressure system brought a period of light wet snow to New Jersey.
Synoptic Discussion
A cold front moved through New Jersey on February 7th. As the front stalled out to the south, a low pressure began to develop in the Carolinas. This low pressure system moved slowly off the coast during the day on the 8th before turning northeast and rapidly intensifying on the night of the 8th. By the morning of the 9th it was several hundred miles southeast of Cape Cod.
Local Discussion
Light precipitation overspread the state during the mid to late afternoon on February 8th. In most locations it began and remained in the form of snow, but it started out as rain before changing to snow across parts of southern New Jersey. The snow tapered off during the late evening. Due to light amounts of precipitation and relatively mild surface temperatures, accumulations were minimal. Most locations received less than an inch of snow, though accumulations reached 1 to 2 inches across parts of Warren, Hunterdon, Middlesex, Mercer, Monmouth and Ocean counties.
New Jersey Snowfall Totals
Individual Snowfall Totals from February 8, 2012
Table of Contents
Storm Summary
Regional Surface Observations
National Weather Service Forecasts
Surface Maps
Satellite Imagery
National Surface Weather Maps - Pressure and Fronts Only
Continental Surface Weather Maps - Pressure and Fronts Only
Sea Level Pressure and 1000 to 500 Millibar Thickness Maps
850 Millibar Maps
700 Millibar Maps
500 Millibar Maps
300 Millibar Maps
200 Millibar Maps
National Radar Imagery
Regional Radar Imagery
Fort Dix Doppler Radar Imagery
Snow storm, October 29-30, 2011
Snow and ice storm, January 21, 2012
Snow storm, February 8, 2012
Snow storm, February 10-11, 2012
Snow storm, February 11-12, 2012
Back to Ray's Winter Storm Archive
Copyright © 2012 by Raymond C Martin Jr. All rights reserved