

Storm description, surface observations, snowfall totals, and images courtesy of the National Climatic Data Center, the National Centers of Environmental Prediction, the Climate Prediction Center, the Hydrometeorological Prediction Center, the Mount Holly National Weather Service Office, the Upton National Weather Service Office, Rutgers University, Plymouth State University, the University of Illinois, the American Meteorological Society, Weather Graphics Technologies, AccuWeather, and the Weather Channel.
Table of Contents
Storm Summary
Regional Surface Observations
National Weather Service Forecasts
Surface Maps
Satellite Imagery
National Surface Weather Maps - Pressure and Fronts Only
Continental Surface Weather Maps - Pressure and Fronts Only
Sea Level Pressure and 1000 to 500 Millibar Thickness Maps
850 Millibar Maps
700 Millibar Maps
500 Millibar Maps
300 Millibar Maps
200 Millibar Maps
National Radar Imagery
Regional Radar Imagery
Fort Dix Doppler Radar Imagery
Contoured Snowfall Totals from January 21, 2012
STORM DESCRIPTION
A wave of low pressure brought a period of snow to most of the state, followed by freezing rain and sleet in central and southern New Jersey. In most of the state this was the largest winter storm during meteological winter 2011-2012, even though the October storm preceeding it was larger.
Synoptic Discussion
A cold front moved across New Jersey early on January 20th, bringing in a fresh batch of cold air to the region. At the same time, a wave of low pressure began to develop further southwest along the same front, in the southern Plains. By the morning of the 21st, this low pressure moved into eastern Kentucky and a secondary low pressure began developing near the mouth of the Cheasapeake Bay. This secondary low strengthened at the original low's expense and moved northeast off the coast. By the late evening of the 21st it was well east of Cape Cod.
Local Discussion
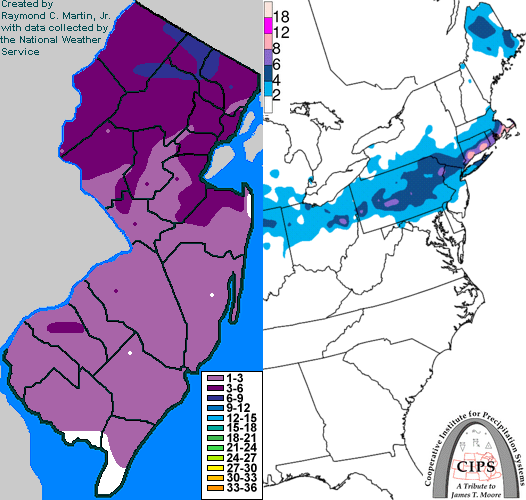
Precipitation overspread New Jersey during the early morning hours on January 21st. It started as snow everywhere, but began to mix with sleet and freezing rain across southern New Jersey well before dawn. By dawn, the snow had changed to sleet and freezing rain as far north as central New Jersey, while snow continued further north. During the morning, surface temperatures warmed in southern and coastal portions of the state, allowing the sleet and freezing rain to transition to rain. Precipitation tapered off from west to east during the mid to late morning hours. Accumulations were light in southern and central New Jersey, becoming more substantial in northern New Jersey, but generally fell short of the totals seen during the late October storm in the northern half of the state. Nevertheless, this ended up being the largest snowfall during the "normal" winter season of December-February nearly everywhere in New Jersey. Snowfall totals ranged from 4 to 8 inches in Passaic County, 3 to 7 inches in Morris County, 2 to 7 inches in Bergen County, 4 to 6 inches in Sussex County, 2 to 6 inches in Warren County, 3 to 5 inches in Hudson and Union counties, 3 to 4 inches in Essex County, 2 to 4 inches in Hunterdon, Middlesex and Somerset counties, a coating to 4 inches in Monmouth County, 2 to 3 inches in Mercer County, 1 to 3 inches in Burlington, Camden, Gloucester and Salem counties, 1 to 2 inches in Cumberland County, a coating to 2 inches in Atlantic and Ocean counties, and an inch or less in Cape May County.
New Jersey Snowfall Totals
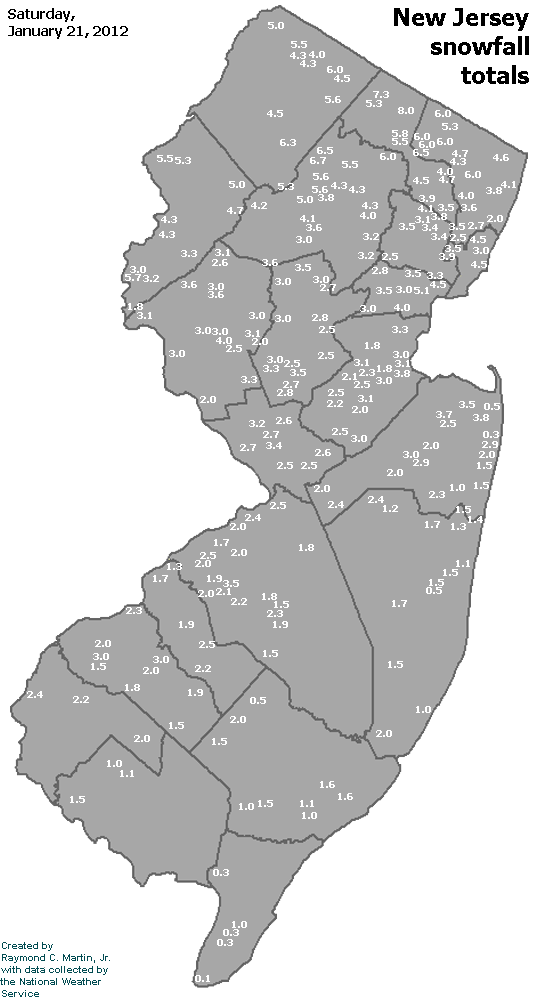
Individual Snowfall Totals from January 21, 2012
Table of Contents
Storm Summary
Regional Surface Observations
National Weather Service Forecasts
Surface Maps
Satellite Imagery
National Surface Weather Maps - Pressure and Fronts Only
Continental Surface Weather Maps - Pressure and Fronts Only
Sea Level Pressure and 1000 to 500 Millibar Thickness Maps
850 Millibar Maps
700 Millibar Maps
500 Millibar Maps
300 Millibar Maps
200 Millibar Maps
National Radar Imagery
Regional Radar Imagery
Fort Dix Doppler Radar Imagery
Snow storm, October 29-30, 2011
Snow and ice storm, January 21, 2012
Snow storm, February 8, 2012
Snow storm, February 10-11, 2012
Snow storm, February 11-12, 2012
Back to Ray's Winter Storm Archive
Copyright © 2012 by Raymond C Martin Jr. All rights reserved