

Storm description, surface observations, snowfall totals, and images courtesy of the National Climatic Data Center, the National Centers of Environmental Prediction, the Climate Prediction Center, the Hydrometeorological Prediction Center, the Mount Holly National Weather Service Office, the Upton National Weather Service Office, Rutgers University, Plymouth State University, the University of Illinois, the American Meteorological Society, Weather Graphics Technologies, AccuWeather, and the Weather Channel.
Table of Contents
Storm Summary
Regional Surface Observations
National Weather Service Forecasts
Surface Maps
Satellite Imagery
National Surface Weather Maps - Pressure and Fronts Only
Continental Surface Weather Maps - Pressure and Fronts Only
Sea Level Pressure and 1000 to 500 Millibar Thickness Maps
850 Millibar Maps
700 Millibar Maps
500 Millibar Maps
300 Millibar Maps
200 Millibar Maps
National Radar Imagery
Regional Radar Imagery
Fort Dix Doppler Radar Imagery
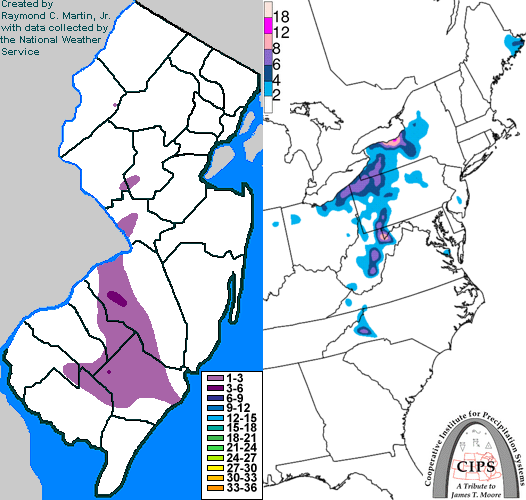
Contoured Snowfall Totals from February 11-12, 2012
STORM DESCRIPTION
Snow showers associated with an arctic cold front dumped a few inches of snow in parts of New Jersey.
Synoptic Discussion
The low pressure system and arctic cold front responsible for the snow showers moved into the northern Plains from southern Canada on February 9th. It reached Chicago by midday on February 10th and passed Cleveland early on the 11th. It crossed New Jersey during the late afternoon on the 11th. By the early morning of the 12th it was several hundred miles east of Cape Hatteras.
Local Discussion
An area of light snow and flurries overspread much of the state during the late afternoon on the 11th. Heavier snow showers then began to develop and move southeast across the state during the early evening. The heavier snow showers dissipated or moved off-shore by midnight and lingering flurries tapered off during the early morning hours on the 12th. Accumulations in most areas were less than 1 inch. However, a corridor extending southward from the Trenton area to northern Atlantic County, then turning southeast toward Atlantic City, received 1 to 3 inches. This band of higher accumulations included portions of Somerset, Hunterdon, Mercer, Burlington, Camden, Gloucester, Salem, Cumberland and Atlantic counties.
New Jersey Snowfall Totals
Individual Snowfall Totals from February 11-12, 2012
Table of Contents
Storm Summary
Regional Surface Observations
National Weather Service Forecasts
Surface Maps
Satellite Imagery
National Surface Weather Maps - Pressure and Fronts Only
Continental Surface Weather Maps - Pressure and Fronts Only
Sea Level Pressure and 1000 to 500 Millibar Thickness Maps
850 Millibar Maps
700 Millibar Maps
500 Millibar Maps
300 Millibar Maps
200 Millibar Maps
National Radar Imagery
Regional Radar Imagery
Fort Dix Doppler Radar Imagery
Snow storm, October 29-30, 2011
Snow and ice storm, January 21, 2012
Snow storm, February 8, 2012
Snow storm, February 10-11, 2012
Snow storm, February 11-12, 2012
Back to Ray's Winter Storm Archive
Copyright © 2012 by Raymond C Martin Jr. All rights reserved