

Storm description, surface observations, snowfall totals, and images courtesy of the National Climatic Data Center, the National Centers of Environmental Prediction, the Climate Prediction Center, the Hydrometeorological Prediction Center, the Mount Holly National Weather Service Office, the Upton National Weather Service Office, Rutgers University, Plymouth State University, the University of Illinois, the American Meteorological Society, Weather Graphics Technologies, AccuWeather, and the Weather Channel.
Table of Contents
Storm Summary
Regional Surface Observations
National Weather Service Forecasts
Surface Maps
Satellite Imagery
National Surface Weather Maps - Pressure and Fronts Only
Continental Surface Weather Maps - Pressure and Fronts Only
Sea Level Pressure and 1000 to 500 Millibar Thickness Maps
850 Millibar Maps
700 Millibar Maps
500 Millibar Maps
300 Millibar Maps
200 Millibar Maps
National Radar Imagery
Regional Radar Imagery
Fort Dix Doppler Radar Imagery
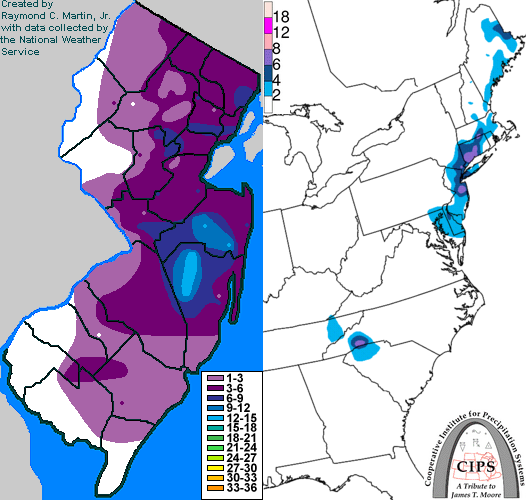
Contoured Snowfall Totals from November 7-8, 2012
STORM DESCRIPTION
A strong nor'easter brought the first widespread snowfall of the 2012-2013 winter season to most of the Garden State in early November, barely one week after Hurricane Sandy had ravaged much of the area.
Synoptic Discussion
A cold front slipped south across the region on November 4th, allowing cold and dry Canadian high pressure to envelop the area. At the same time, a low pressure system dove southeastward out of the Canadian prairies into the Dakotas. By midday on the 5th, this low pressure system had reached Missouri, and by the early morning of the 6th, it had reached the Gulf Coast. By this time, a new low pressure began to develop on the now-stalled cold front located off the Southeast coast. By midday on the 6th, energy from the Canadian system began to transfer to the new low off the Southeast coast, which began to strengthen and move north. By the early morning of November 7th, it was strengthening due east of Virginia Beach, and by midday on the 7th, it had reached a position due east of Cape Henlopen and due south of Nantucket. From here it moved very slowly, reaching a position due east of New York City and due south of Cape Cod by the early morning of the 8th. From here it continued moving northeast towards Nova Scotia, but at an extremely slow rate.
Local Discussion
Precipitation overspread the state from southeast to northwest during the morning and midday hours on the 7th. Initally warm surface temperatures in the upper 30s to low 40s resulted in a start as rain in most areas, but heavier precipitation resulted in dynamic cooling and a change to snow across most of the state. Heavy bands of precipitation, mostly in the form of wet snow, enveloped parts of southeastern, central and northeastern New Jersey during the afternoon and evening hours on the 7th. Precipitation bands broke up and retreated eastward during the early morning hours on the 8th. Snow accumulations were heaviest in east-central New Jersey away from the immediate coast, where heavy banded precipitation lingered for many hours during the afternoon and evening of the 7th, while very little snow fell in far northwestern and southwestern New Jersey where heavy precipitation never fell. Totals ranged from 2 to 13 inches in Monmouth and Ocean counties, 2 to 8 inches in Bergen and Middlesex counties, 3 to 7 inches in Union and Mercer counties, 1 to 7 inches in Somerset County, 2 to 6 inches in Essex, Hudson, Morris and Passaic counties, 1 to 5 inches in Burlington, Sussex and Atlantic counties, 1 to 3 inches in Camden County, and a trace to 3 inches in Cumberland, Gloucester, Hunterdon, Salem, Warren and Cape May counties.
New Jersey Snowfall Totals
Individual Snowfall Totals from November 7-8, 2012
Table of Contents
Storm Summary
Regional Surface Observations
National Weather Service Forecasts
Surface Maps
Satellite Imagery
National Surface Weather Maps - Pressure and Fronts Only
Continental Surface Weather Maps - Pressure and Fronts Only
Sea Level Pressure and 1000 to 500 Millibar Thickness Maps
850 Millibar Maps
700 Millibar Maps
500 Millibar Maps
300 Millibar Maps
200 Millibar Maps
National Radar Imagery
Regional Radar Imagery
Fort Dix Doppler Radar Imagery
Snow storm, November 7-8, 2012
Snow and ice storm, December 29, 2012
Snow storm, January 25, 2013
Snow and ice storm, February 8-9, 2013
Snow storm, March 7-8, 2013
Snow storm, March 16, 2013
Back to Ray's Winter Storm Archive
Copyright © 2014 by Raymond C Martin Jr. All rights reserved