

Storm description, surface observations, snowfall totals, and images courtesy of the National Climatic Data Center, the National Centers of Environmental Prediction, the Climate Prediction Center, the Hydrometeorological Prediction Center, the Mount Holly National Weather Service Office, the Upton National Weather Service Office, Rutgers University, Plymouth State University, the University of Illinois, the American Meteorological Society, Weather Graphics Technologies, AccuWeather, and the Weather Channel.
Table of Contents
Storm Summary
Regional Surface Observations
National Weather Service Forecasts
Surface Maps
Satellite Imagery
National Surface Weather Maps - Pressure and Fronts Only
Continental Surface Weather Maps - Pressure and Fronts Only
Sea Level Pressure and 1000 to 500 Millibar Thickness Maps
850 Millibar Maps
700 Millibar Maps
500 Millibar Maps
300 Millibar Maps
200 Millibar Maps
National Radar Imagery
Regional Radar Imagery
Fort Dix Doppler Radar Imagery
Contoured Snowfall Totals from March 7-8, 2013
STORM DESCRIPTION
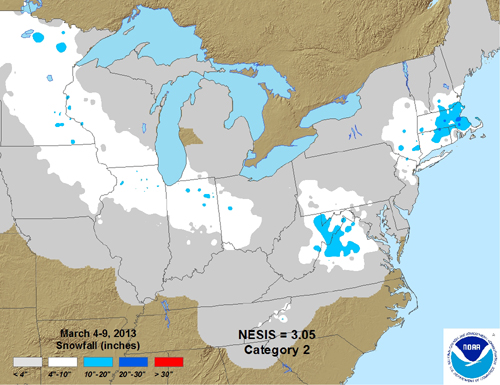
A retrograding nor'easter brought a period of snow to most of the state, with moderate to heavy snow falling in parts of northeastern New Jersey.
Synoptic Discussion
A low pressure system entered the northern Plains from southern Canada on March 3rd. By midday on the 4th, the primary low pressure was located in the Dakotas, while a secondary low pressure had developed well to the south in Oklahoma. By midday on the 5th, the low pressures were Illinois and Kentucky respectively, while by midday on the 6th they had consolidated and developed into a nor'easter over the Delmarva peninsula. Despite its close proximity, most of New Jersey received only light to moderate rain from the system's initial pass on the 6th, due in part to relatively mild air in place at the time. By the early morning of the 7th the low pressure was well off the coast, and by midday of the 7th it had reached a position due east of Cape Henlopen and due south of Nova Scotia. However, it remained in this general location for the next 24 hours while a trough of low pressure rotated southwestward around the low and back across the Northeastern United States, this time with plenty of cold air. By late on the 8th and early on the 9th, the low pressure finally started to move east into the open Atlantic once again.
Local Discussion
Precipitation very gradually overspread New Jersey from northeast to southwest during the evening of the 7th and early morning of the 8th. Temperatures were cold enough aloft such that after an intial period of rain in many places due to lingering low level warm air, precipitation changed over to snow. Snow fell at a moderate to heavy clip in parts of central and northeastern New Jersey during the morning hours on the 8th, with lighter snow to the southwest. Precpitation gradually ended from northwest to southeast during the afternoon on the 8th, changing back to rain in many places before ending as temperatures warmed back towards 40 degrees. Snow totals were heaviest in northeastern New Jersey where snow started earliest and lingered longest, while very little snow fell in southwestern New Jersey. Totals ranged from 6 to 12 inches in Passaic County, 3 to 11 inches in Sussex, Bergen and Morris counties, 4 to 8 inches in Hudson, Union and Essex counties, 3 to 6 inches in Somerset, Middlesex, Hunterdon and Mercer counties, 1 to 5 inches in Warren, Monmouth and Burlington counties, a coating to 3 inches in Ocean, Camden, Gloucester and Atlantic counties, and less than an inch in Cumberland, Salem and Cape May counties.
New Jersey Snowfall Totals
Individual Snowfall Totals from March 7-8, 2013
Regional Snowfall Totals
Snowfall Totals from March 7-8, 2013
Table of Contents
Storm Summary
Regional Surface Observations
National Weather Service Forecasts
Surface Maps
Satellite Imagery
National Surface Weather Maps - Pressure and Fronts Only
Continental Surface Weather Maps - Pressure and Fronts Only
Sea Level Pressure and 1000 to 500 Millibar Thickness Maps
850 Millibar Maps
700 Millibar Maps
500 Millibar Maps
300 Millibar Maps
200 Millibar Maps
National Radar Imagery
Regional Radar Imagery
Fort Dix Doppler Radar Imagery
Snow storm, November 7-8, 2012
Snow and ice storm, December 29, 2012
Snow storm, January 25, 2013
Snow and ice storm, February 8-9, 2013
Snow storm, March 7-8, 2013
Snow storm, March 16, 2013
Back to Ray's Winter Storm Archive
Copyright © 2014 by Raymond C Martin Jr. All rights reserved