

Storm description, surface observations, snowfall totals, and images courtesy of the National Climatic Data Center, the National Centers of Environmental Prediction, the Climate Prediction Center, the Hydrometeorological Prediction Center, the Mount Holly National Weather Service Office, the Upton National Weather Service Office, Rutgers University, Plymouth State University, the University of Illinois, the American Meteorological Society, Weather Graphics Technologies, AccuWeather, and the Weather Channel.
Table of Contents
Storm Summary
Regional Surface Observations
National Weather Service Forecasts
Surface Maps
Satellite Imagery
Sea Level Pressure and 1000 to 500 Millibar Thickness Maps
850 Millibar Maps
700 Millibar Maps
500 Millibar Maps
300 Millibar Maps
200 Millibar Maps
National Radar Imagery
Local Radar Imagery
Fort Dix Doppler Radar Imagery
Contoured Snowfall Totals from January 11, 1997
STORM DESCRIPTION
A polar vortex associated with a reinforcing shot of cold air brought a surprisingly intense burst of snow to most of the state.
Synoptic Discussion
A weak low pressure area developed over Virginia on the night of the 10th along a secondary cold front. The low moved northeast and reached Block Island off of Rhode Island on the morning of the 11th.
Local Discussion
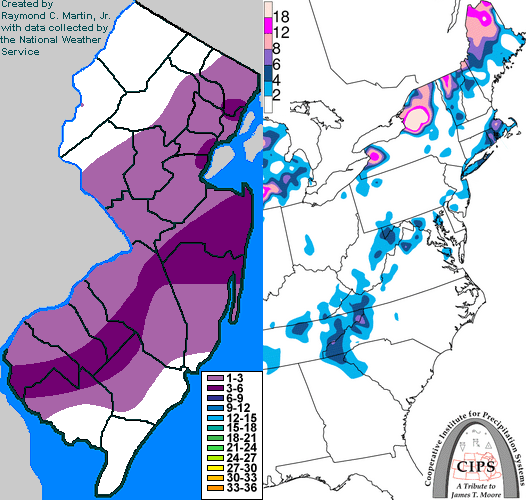
Snow began quickly between midnight and 3am EST on the 11th, becoming moderate in intensity. It began as rain in far southern New Jersey before changing to snow as the trailing cold front passed through, but all areas further north saw all snow. Precipitation tapered off between 5am EST and 8am EST. Accumulations generally averaged 2 to 4 inches, except for Cumberland, western Atlantic, southern Ocean, Hunterdon, northern Somerset, Morris, and northern Passaic counties, which saw around an inch, while Cape May, eastern Atlantic, Warren and Sussex counties saw less than an inch. The maximum of 4 inches occured in eastern Burlington, northwest Ocean, and southern Monmouth counties.
New Jersey Snowfall Totals
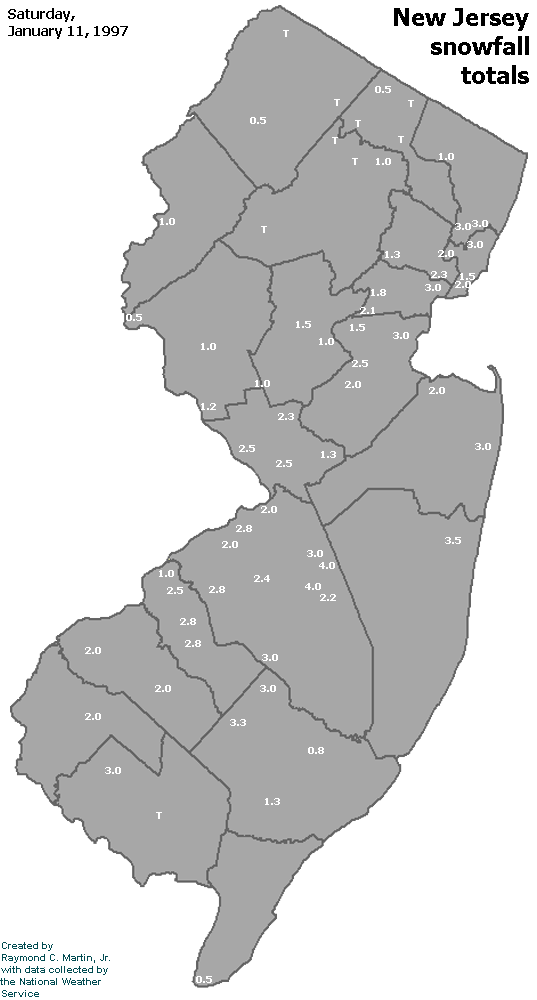
Individual Snowfall Totals from January 11, 1997
Table of Contents
Storm Summary
Regional Surface Observations
National Weather Service Forecasts
Surface Maps
Satellite Imagery
Sea Level Pressure and 1000 to 500 Millibar Thickness Maps
850 Millibar Maps
700 Millibar Maps
500 Millibar Maps
300 Millibar Maps
200 Millibar Maps
National Radar Imagery
Local Radar Imagery
Fort Dix Doppler Radar Imagery
Snow and ice storm, January 9, 1997
Snow storm, January 11, 1997
Snow storm, February 8-9, 1997
Snow storm, February 14, 1997
Snow storm, March 3, 1997
Snow and ice storm, March 9-10, 1997
Snow storm, March 31-April 1, 1997
Snow storm, April 18, 1997
Back to Ray's Winter Storm Archive
Copyright © 2012 by Raymond C Martin Jr. All rights reserved