

Storm description, surface observations, snowfall totals, and images courtesy of the National Climatic Data Center, the National Centers of Environmental Prediction, the Climate Prediction Center, the Hydrometeorological Prediction Center, the Mount Holly National Weather Service Office, the Upton National Weather Service Office, Rutgers University, Plymouth State University, the University of Illinois, the American Meteorological Society, Weather Graphics Technologies, AccuWeather, and the Weather Channel.
Table of Contents
Storm Summary
Regional Surface Observations
National Weather Service Forecasts
Satellite Imagery
National Surface Weather Maps - Pressure and Fronts Only
Sea Level Pressure and 1000 to 500 Millibar Thickness Maps
850 Millibar Maps
700 Millibar Maps
500 Millibar Maps
300 Millibar Maps
200 Millibar Maps
National Radar Imagery
Fort Dix Doppler Radar Imagery
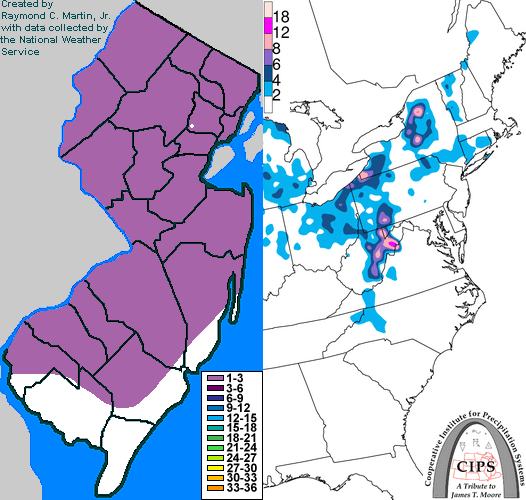
Contoured Snowfall Totals from February 3, 2000
STORM DESCRIPTION
An Alberta Clipper produced a period of light snow across most of New Jersey.
Synoptic Discussion
The low pressure and associated cold front developed in the lee of the Canadian Rockies early on the 2nd and moved southeastward towards the Mid-Atlantic by the 3rd. The low pressure passed just north of New Jersey, and the trailing cold front passed through New Jersey early on the morning of the 4th. By mid-day on the 4th the system was along the New England coast.
Local Discusion
As the Clipper approached New Jersey on the late afternoon of the 3rd, light snow preceeding it crossed the state from west to east. Snow lingered through the evening in most areas and finally ended around midnight on the 4th. The heaviest snow bands crossed New Jersey between 5 PM EST and 9 PM EST on the 3rd. Accumulations were quite uniform and ranged from 1 to 2 inches across most of the state, except the far south where less than an inch fell.
New Jersey Snowfall Totals
Individual Snowfall Totals from February 3, 2000
Table of Contents
Storm Summary
Regional Surface Observations
National Weather Service Forecasts
Satellite Imagery
National Surface Weather Maps - Pressure and Fronts Only
Sea Level Pressure and 1000 to 500 Millibar Thickness Maps
850 Millibar Maps
700 Millibar Maps
500 Millibar Maps
300 Millibar Maps
200 Millibar Maps
National Radar Imagery
Fort Dix Doppler Radar Imagery
Snow storm, January 20-21, 2000
Snow and ice storm, January 25, 2000
Snow and ice storm, January 30-31, 2000
Snow storm, February 3, 2000
Snow and ice storm, February 18-19, 2000
Snow storm, April 9, 2000
Back to Ray's Winter Storm Archive
Copyright © 2012 by Raymond C Martin Jr. All rights reserved