

Storm description, surface observations, snowfall totals, and images courtesy of the National Climatic Data Center, the National Centers of Environmental Prediction, the Climate Prediction Center, the Hydrometeorological Prediction Center, the Mount Holly National Weather Service Office, the Upton National Weather Service Office, Rutgers University, Plymouth State University, the University of Illinois, the American Meteorological Society, Weather Graphics Technologies, AccuWeather, and the Weather Channel.
Table of Contents
Storm Summary
Regional Surface Observations
National Weather Service Forecasts
Surface Maps
Satellite Imagery
National Surface Weather Maps - Pressure and Fronts Only
Sea Level Pressure and 1000 to 500 Millibar Thickness Maps
850 Millibar Maps
700 Millibar Maps
500 Millibar Maps
300 Millibar Maps
200 Millibar Maps
National Radar Imagery
Local Radar Imagery
Fort Dix Doppler Radar Imagery
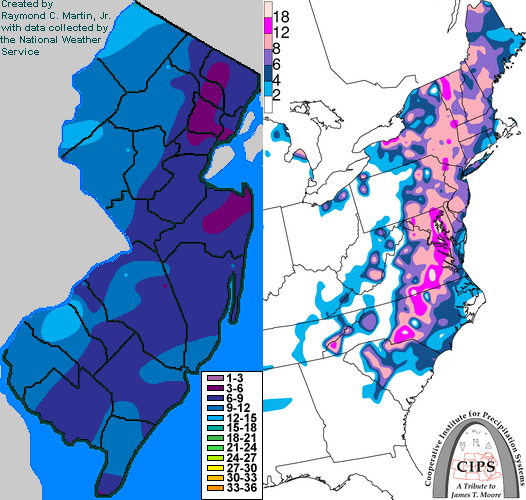
Contoured Snowfall Totals from January 25, 2000
STORM DESCRIPTION
The most intense winter storm since the Blizzard of 1996 burried New Jersey under 4 to 15 inches of snow, sleet, and freezing rain, and battered the coast with wind gusts of up to 60 mph, causing moderate coastal flooding at the time of high tide as well as snow drifts of up to 4 feet.
Synoptic Discussion
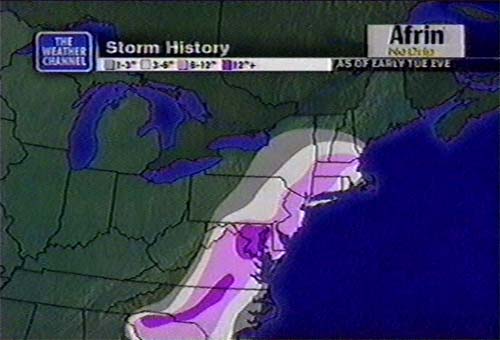
The storm began as a weak low pressure system on a stationary front in southern Texas on the 23rd. By the morning of the 24th, it was located in the northeastern Gulf of Mexico near Apalachicola, Florida. By the evening of the 24th, the storm was rapidly intensifying and hugging the South Carolina coast. By 7AM EST on the 25th, it was a 980 millibar low near Cape Hattaras, North Carolina. While only barely strengthening more, the storm moved northeastwards along the Atlantic Seaboard. By 7PM EST, it was a 975 millibar low located 80 miles east of Long Beach Island, New Jersey. It then began to weaken and by 7AM EST on the 26th, it was a 988 millibar low located just east of Portland, Maine.
Local Discusion
Snow began with a vengeance between 2AM and 7AM on the 25th across the state. It began in Cape May County and spread north and northwestwards. Snowfall rates of 2 inches per hour were common during the first few hours of the storm with the intial band of precipitation. By 6AM EST, some locations already had 4 inches of new snow on the ground. After 6AM EST, warm air at mid-levels began to work northwards over the state, cutting precipitation off from south to north. This also caused the precipitation to change form from snow to sleet and freezing rain. Snow continued over northwestern New Jersey, but its intensity was lighter during the late morning and afternoon hours than it had been earlier in the day. Meanwhile, northeastern, central, and southern section remained in the storm's "dry slot", an area of much lighter or non-existant precipitation, for most of the daylight hours. After 3PM EST, cold air began to work back into the state, and precipitation began to change back to snow. A final heavy burst of snow worked across the state during the evening of the 25th just before precipitation ended. Snow ended across the entire state by midnight EST on the 26th. Snowfall accumulations were 6 to 12 inches (with isolated amounts up to 15 inches) in Sussex, Warren, Morris, Hunterdon, and Somerset counties in northwestern New Jersey, as well as in Mercer, Burlington, Ocean, Camden, Gloucester, Salem, Cumberland, Atlantic, and Cape May counties in southern New Jersey. Northeastern New Jersey saw less snow, with 4 to 8 inches falling in Passaic, Bergen, Hudson, Essex, Union, Middlesex, and Monmouth counties. This storm also brought moderate tidal flooding at the time of high tide at midday on the 25th, as well as some beach erosion. Tides reached 7.7 feet above mean low water at Sandy Hook and Atlantic City, while they reached 8.5 feet in Cape May.
New Jersey Snowfall Totals
Individual Snowfall Totals from January 25, 2000
Regional Snowfall Totals
Snowfall totals from 0400Z 26 January 2000 (11PM EST 25 January 2000)
Table of Contents
Storm Summary
Regional Surface Observations
National Weather Service Forecasts
Surface Maps
Satellite Imagery
National Surface Weather Maps - Pressure and Fronts Only
Sea Level Pressure and 1000 to 500 Millibar Thickness Maps
850 Millibar Maps
700 Millibar Maps
500 Millibar Maps
300 Millibar Maps
200 Millibar Maps
National Radar Imagery
Local Radar Imagery
Fort Dix Doppler Radar Imagery
Snow storm, January 20, 2000
Snow and ice storm, January 25, 2000
Snow and ice storm, January 30-31, 2000
Snow storm, February 3, 2000
Snow and ice storm, February 18-19, 2000
Snow storm, April 9, 2000
Back to Ray's Winter Storm Archive
Copyright © 2012 by Raymond C Martin Jr. All rights reserved