

Storm description, surface observations, snowfall totals, and images courtesy of the National Climatic Data Center, the National Centers of Environmental Prediction, the Climate Prediction Center, the Hydrometeorological Prediction Center, the Mount Holly National Weather Service Office, the Upton National Weather Service Office, Rutgers University, Plymouth State University, the University of Illinois, the American Meteorological Society, Weather Graphics Technologies, AccuWeather, and the Weather Channel.
Table of Contents
Storm Summary
Regional Surface Observations
National Weather Service Forecasts
Surface Maps
Satellite Imagery
National Surface Weather Maps - Pressure and Fronts Only
Continental Surface Weather Maps - Pressure and Fronts Only
Sea Level Pressure and 1000 to 500 Millibar Thickness Maps
850 Millibar Maps
700 Millibar Maps
500 Millibar Maps
300 Millibar Maps
200 Millibar Maps
National Radar Imagery
Regional Radar Imagery
Fort Dix Doppler Radar Imagery
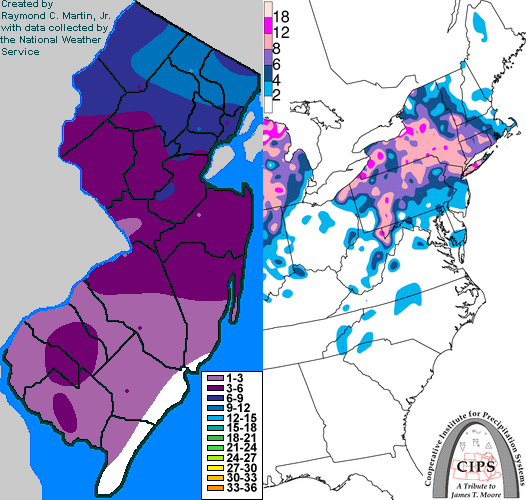
Contoured Snowfall Totals from January 27-28, 2004
STORM DESCRIPTION
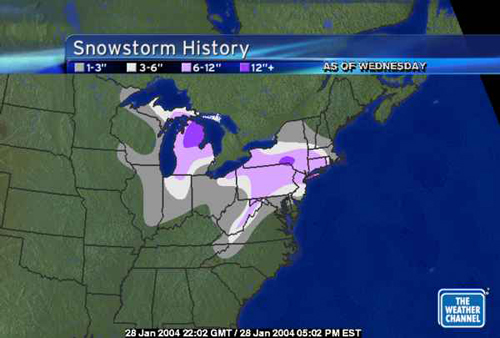
The combination of a high pressure system over nearby Canada and a pair of low pressure systems moving in from the Midwest produced a wintry mix of snow, sleet and freezing rain over New Jersey, with heavy snow accumulations in the northern half of the state.
Synoptic Discussion
The primary low pressure system moved eastward from the lower Ohio Valley on the afternoon of the 26th to Ohio on the morning of the 27th. As it turned northward into Michigan on the afternoon of the 27th, a secondary low pressure developed off the Virginia coast. The second low strengthened as the primary low weakened on the evening of the 27th, and by the early morning of the 28th it had moved northeastward off the New Jersey coast. Later that morning, the low turned eastward and headed out to sea. The storm was prevented from moving further north by the same Canadian high pressure system which kept the region cold enough for frozen precipitation.
Local Discussion
While spotty light freezing rain and drizzle fell across parts of the state during the daylight hours of the 27th, only light icing was reported. No icing occured in the southern 3 counties where temperatures were above freezing much of the day. As the storm system approached from the west and the secondary low developed near Virginia, precipitation rapidly increased in intensity from southwest to northeast across the state late in the afternoon. Due to a layer of warmer air aloft, most locations saw the precipitation intensify as sleet and freezing rain and then gradually change to snow between 6PM and 9 PM EST as colder air worked southward across the state. The exceptions were far northern areas, where the warm air layer was missing and the precipitation intensified as snow, and far southern areas, where surface temperatures were above freezing and the precipitation intensified as rain. The rain changed to snow in far southern parts of the state between 8PM and 10PM EST. The heaviest snow fell in the northern half of the state between 7PM EST on the 27th and 3AM EST on the 28th. The snow gradually ended from southwest to northeast between 1AM and 11AM EST on the 28th. Snow accumulations ranged from 9 to 12 inches in Passaic County, 6 to 11 inches in Bergen, Hudson, Essex, Morris, and Sussex counties, 5 to 8 inches in Warren and Union counties, 4 to 6 inches in Hunterdon, Somerset, and Middlesex counties, 2 to 5 inches in Mercer, Monmouth and Burlington counties, 2 to 4 inches in Ocean County, 1 to 3 inches in Camden, Gloucester, Salem, Cumberland and Atlantic counties, and up to 1 inch in Cape May County. Ice accrual was light, with up to two tenths of an inch reported in central parts of the state.
New Jersey Snowfall Totals
Individual Snowfall Totals from January 27-28, 2004
Regional Snowfall Totals
Snowfall Totals from 2200Z 28 January 2004 (5PM EST 28 January 2004)
Table of Contents
Storm Summary
Regional Surface Observations
National Weather Service Forecasts
Surface Maps
Satellite Imagery
National Surface Weather Maps - Pressure and Fronts Only
Continental Surface Weather Maps - Pressure and Fronts Only
Sea Level Pressure and 1000 to 500 Millibar Thickness Maps
850 Millibar Maps
700 Millibar Maps
500 Millibar Maps
300 Millibar Maps
200 Millibar Maps
National Radar Imagery
Regional Radar Imagery
Fort Dix Doppler Radar Imagery
Snow and ice storm, December 5-6, 2003
Snow storm, December 14-15, 2003
Snow storm, January 14-15, 2004
Snow and ice storm, January 17-18, 2004
Snow storm, January 26, 2004
Snow and ice storm, January 27-28, 2004
Snow and ice storm, March 16-17, 2004
Snow storm, March 18-19, 2004
Back to Ray's Winter Storm Archive
Copyright © 2012 by Raymond C Martin Jr. All rights reserved