

Storm description, surface observations, snowfall totals, and images courtesy of the National Climatic Data Center, the National Centers of Environmental Prediction, the Climate Prediction Center, the Hydrometeorological Prediction Center, the Mount Holly National Weather Service Office, the Upton National Weather Service Office, Rutgers University, Plymouth State University, the University of Illinois, the American Meteorological Society, Weather Graphics Technologies, AccuWeather, and the Weather Channel.
Table of Contents
Storm Summary
Regional Surface Observations
National Weather Service Forecasts
Surface Maps
Satellite Imagery
National Surface Weather Maps - Pressure and Fronts Only
Continental Surface Weather Maps - Pressure and Fronts Only
Sea Level Pressure and 1000 to 500 Millibar Thickness Maps
850 Millibar Maps
700 Millibar Maps
500 Millibar Maps
300 Millibar Maps
200 Millibar Maps
National Radar Imagery
Regional Radar Imagery
Fort Dix Doppler Radar Imagery
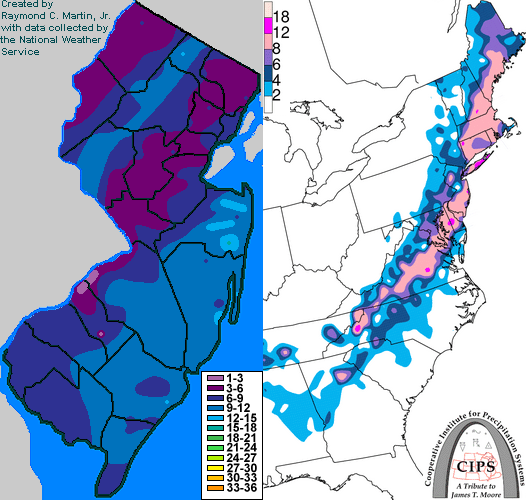
Contoured Snowfall Totals from March 1-2, 2009
STORM DESCRIPTION
A nor'easter brought a major snowfall to much of New Jersey.
Synoptic Discussion
A cold front moved through New Jersey during the evening of the 27th and early morning of the 28th. The front then stalled over the Southeast during the day on the 28th as a low pressure developed over the lower Mississippi Valley. The low moved eastward into Georgia by midnight on the 1st, then turned northeast and crossed the Carolinas during the day on the 1st. By the morning of the 2nd, the low was due east of New Jersey, and by midnight on the 3rd it reached the Canadian Maritimes.
Local Discussion
Snow associated with the surface low pressure overspread New Jersey from southeast to northwest during the evening of the 1st. Two distinct bands of heavier snow developed during the overnight hours. The first was focused over southeastern and east-central New Jersey, while the second affected parts of northwestern New Jersey. In both bands, snowfall accumulation rates reached 1 to 2 inches per hour. In between the two heavier bands, snow fell at lighter rates across much of west-central and northeastern New Jersey. Snowfall rates were briefly intensified across southeastern New Jersey as a gravity wave moved through from southwest to northeast between 1 AM EST and 4 AM EST on the 2nd. The gravity wave also produced wind gusts of more than 50 mph. The first wave of snow moved out of the state from southwest to northeast between 2 AM and 6 AM EST on the 2nd, resulting in a lull. A second, less intense band of snow associated with the upper-level low moved into the state after dawn on the 2nd. Snow then gradually tapered off to snow showers and flurries during the midday and afternoon hours of the 2nd. Snowfall accumulations ranged from 6 to 15 inches in Monmouth County, 8 to 13 inches in Ocean County, 3 to 13 inches in Passaic County, 6 to 12 inches in Atlantic, Cape May, Cumberland, Gloucester and Salem counties, 4 to 11 inches in Hunterdon, Warren, Sussex and Morris counties, 3 to 10 inches in Burlington and Camden counties, and 4 to 7 inches in Bergen, Essex, Hudson, Mercer, Middlesex, Somerset and Union counties.
New Jersey Snowfall Totals
Individual Snowfall Totals from March 1-2, 2009
Table of Contents
Storm Summary
Regional Surface Observations
National Weather Service Forecasts
Surface Maps
Satellite Imagery
National Surface Weather Maps - Pressure and Fronts Only
Continental Surface Weather Maps - Pressure and Fronts Only
Sea Level Pressure and 1000 to 500 Millibar Thickness Maps
850 Millibar Maps
700 Millibar Maps
500 Millibar Maps
300 Millibar Maps
200 Millibar Maps
National Radar Imagery
Regional Radar Imagery
Fort Dix Doppler Radar Imagery
Snow and ice storm, December 16-17, 2008
Snow storm, January 19, 2009
Snow and ice storm, January 27-28, 2009
Snow storm, February 2-4, 2009
Snow storm, March 1-2, 2009
Back to Ray's Winter Storm Archive
Copyright © 2012 by Raymond C Martin Jr. All rights reserved