

Storm description, surface observations, snowfall totals, and images courtesy of the National Climatic Data Center, the National Centers of Environmental Prediction, the Climate Prediction Center, the Hydrometeorological Prediction Center, the Mount Holly National Weather Service Office, the Upton National Weather Service Office, Rutgers University, Plymouth State University, the University of Illinois, the American Meteorological Society, Weather Graphics Technologies, AccuWeather, and the Weather Channel.
Table of Contents
Storm Summary
Regional Surface Observations
Satellite Imagery
Sea Level Pressure and 1000 to 500 Millibar Thickness Maps
850 Millibar Maps
700 Millibar Maps
500 Millibar Maps
300 Millibar Maps
200 Millibar Maps
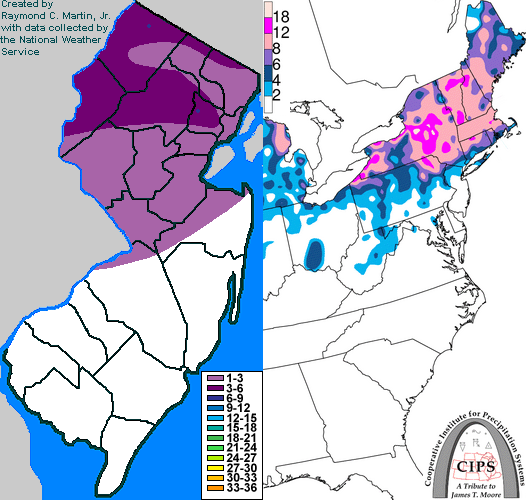
Contoured Snowfall Totals from January 7-8, 1994
STORM DESCRIPTION
A slow moving storm system produced the worst ice storm on record across central New Jersey, while a combination of snow and ice fell across northern New Jersey and mainly rain fell in southern New Jersey.
Synoptic Discussion
On January 5th, a storm system moved southeastward along the Front Range of the Rockies, reaching Oklahoma that evening. It then turned east-northeastward, reaching the lower Ohio Valley by the evening of January 6th. Meanwhile, a strong cold front pushed southeastward across the Northeast on the 6th, becoming stationary across the Mid-Atlantic that night. The storm slowly moved east-northeastward along the stalled front from the Ohio Valley to the Mid-Atlantic on January 7th and reached the Atlantic coast early on January 8th. By the evening of the 8th, the storm had reached Nova Scotia.
Local Discussion
Precipitation developed across New Jersey during the pre-dawn hours of January 7th. Across northern New Jersey, precipitation was mainly in the form of sleet and freezing rain at first, but as colder air pushed southward at all levels of the atmosphere, it mixed with and changed to snow during the afternoon of the 7th. It then changed back to sleet and freezing rain on the night of the 7th as warm air returned at mid levels. Further south across central New Jersey, precipitation was almost exclusively in the form of freezing rain, though some sleet mixed in during the afternoon of the 7th. In much of southern New Jersey, the low levels of the atmosphere remained just warm enough to keep the precipitation in the form of plain rain for most of the storm. Precipitation became moderate to occasionally heavy during the night of the 7th as the center of the storm approached. It then briefly changed to snow before ending from west to east near dawn on January 8th as cold air briefly wrapped back across the state behind the storm. Ice accretion from freezing rain exceeded 1 inch across much of central New Jersey, making this the worst ice storm in modern times across this part of the state. Further north, snow and ice accumulations ranged from 2 to 8 inches. In southern New Jersey, warm air at low levels prevented much more than trace amounts of ice and snow from falling.
New Jersey Snowfall Totals
Individual Snowfall Totals from January 7-8, 1994
Table of Contents
Storm Summary
Regional Surface Observations
Satellite Imagery
Sea Level Pressure and 1000 to 500 Millibar Thickness Maps
850 Millibar Maps
700 Millibar Maps
500 Millibar Maps
300 Millibar Maps
200 Millibar Maps
Snow storm, December 29-30, 1993
Ice storm, January 3-4, 1994
Ice storm, January 7-8, 1994
Snow and ice storm, January 17-18, 1994
Snow storm, January 25-26, 1994
Snow and ice storm, February 8-9, 1994
Snow and ice storm, February 11, 1994
Snow and ice storm, February 23-24, 1994
Snow and ice storm, March 2-3, 1994
Snow storm, March 18, 1994
Back to Ray's Winter Storm Archive
Copyright © 2012 by Raymond C Martin Jr. All rights reserved