

Storm description, surface observations, snowfall totals, and images courtesy of the National Climatic Data Center, the National Centers of Environmental Prediction, the Climate Prediction Center, the Hydrometeorological Prediction Center, the Mount Holly National Weather Service Office, the Upton National Weather Service Office, Rutgers University, Plymouth State University, the University of Illinois, the American Meteorological Society, Weather Graphics Technologies, AccuWeather, and the Weather Channel.
Table of Contents
Storm Summary
Regional Surface Observations
Satellite Imagery
Sea Level Pressure and 1000 to 500 Millibar Thickness Maps
850 Millibar Maps
700 Millibar Maps
500 Millibar Maps
300 Millibar Maps
200 Millibar Maps
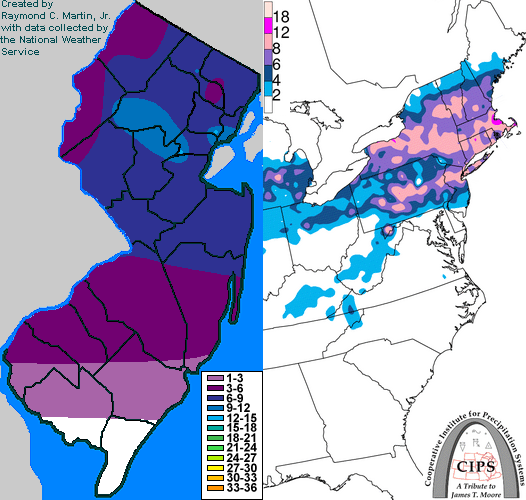
Contoured Snowfall Totals from February 8-9, 1994
STORM DESCRIPTION
The combination of a stalled frontal boundary and several waves of low pressure resulted in a significant snow and ice storm across most of New Jersey.
Synoptic Discussion
A cold front pushed southeastward across the Northeast on February 7th, stalling out across the Mid-Atlantic. During the 8th and 9th, several waves of low pressure developed in the southern Plains and moved east-northeast along the stalled front. The last wave passed off the coast late on the 9th as the front finally began pushing further south once again.
Local Discussion
Moderate to heavy snow overspread most of the state during the morning of February 8th, accompanied by thunder and lightning in parts of northern New Jersey. Across southern New Jersey, the snow quickly mixed with and changed to sleet and freezing rain during the midday hours. The change to sleet and freezing rain waited until the mid-afternoon across central New Jersey, and did not occur until that evening across most of northern New Jersey. Periods of sleet and freezing rain, occasionally mixed with snow, continued across most of the state during the night of the 8th and day on the 9th, finally tapering off from northwest to southeast during the late afternoon and evening of the 9th. Snow and ice ccumulations were highest across northern New Jersey where they averaged 6 to 12 inches. Further south in central New Jersey, accumulations were generally in the 4 to 8 inch range, while only a coating to 4 inches accumulated across southern New Jersey. Ice accretion was generally around a quarter of an inch, with the highest amounts in southern New Jersey.
New Jersey Snowfall Totals
Individual Snowfall Totals from February 8-9, 1994
Table of Contents
Storm Summary
Regional Surface Observations
Satellite Imagery
Sea Level Pressure and 1000 to 500 Millibar Thickness Maps
850 Millibar Maps
700 Millibar Maps
500 Millibar Maps
300 Millibar Maps
200 Millibar Maps
Snow storm, December 29-30, 1993
Ice storm, January 3-4, 1994
Ice storm, January 7-8, 1994
Snow and ice storm, January 17-18, 1994
Snow storm, January 25-26, 1994
Snow and ice storm, February 8-9, 1994
Snow and ice storm, February 11, 1994
Snow and ice storm, February 23-24, 1994
Snow and ice storm, March 2-3, 1994
Snow storm, March 18, 1994
Back to Ray's Winter Storm Archive
Copyright © 2012 by Raymond C Martin Jr. All rights reserved