

Storm description, surface observations, snowfall totals, and images courtesy of the National Climatic Data Center, the National Centers of Environmental Prediction, the Climate Prediction Center, the Hydrometeorological Prediction Center, the Mount Holly National Weather Service Office, the Upton National Weather Service Office, Rutgers University, Plymouth State University, the University of Illinois, the American Meteorological Society, Weather Graphics Technologies, AccuWeather, and the Weather Channel.
Table of Contents
Storm Summary
Regional Surface Observations
Satellite Imagery
Sea Level Pressure and 1000 to 500 Millibar Thickness Maps
850 Millibar Maps
700 Millibar Maps
500 Millibar Maps
300 Millibar Maps
200 Millibar Maps
Contoured Snowfall Totals from March 2-3, 1994
STORM DESCRIPTION
A powerful nor'easter brought two days of rain, sleet, snow, high winds, coastal flooding and beach erosion to New Jersey.
Synoptic Discussion
The storm system developed along the Front Range of the Rockies on February 27th. It sank southward into western Texas on February 28th, moved eastward to Louisiana on March 1st, and reached South Carolina on the 2nd. It then turned northeastward, strengthening rapidly as it reached the Delmarva peninsula early on the 3rd. The storm continued moving northeastward but only strengthened a little more, reaching Nova Scotia early on the 4th.
Local Discussion
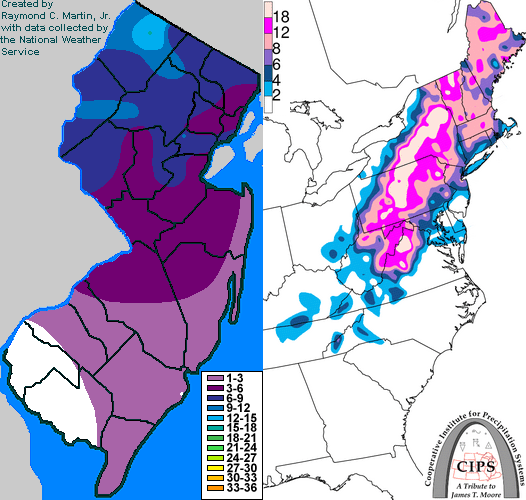
Precipitation slowly overspread the state from south to north during the day on the 2nd, becoming heavy at times several hours after beginning. Across the south, precipitation that began in the form of snow changed to sleet and then rain by midday on the 2nd as warm air moved northward both at the surface and aloft. Further north, precipitation gradually mixed with and changed to sleet and rain across central New Jersey during the night of the 2nd. Across northern New Jersey, precipitation mixed with sleet, but generally remained in frozen form for the duration of the storm. Precipitation intensity decreased significantly overnight on the 2nd and continued at a very light rate for most of the 3rd. The rain and drizzle across southern and central New Jersey and the sleet and drizzle across northern New Jersey briefly mixed with snow before ending during the evening of the 3rd as cold air wrapped back across the state in the storm's wake. Accumulations were highest across the northwest, where they averaged from 8 to 16 inches. Across northeastern and central New Jersey, accumulations ranged from 5 to 8 inches, while across east-central and southern New Jersey, accumulations were mainly on the order of a coating to 4 inches. The storm also caused wind gusts in excess of 60 mph, especially along the coast, which in turn resulted in significant beach erosion and mostly minor coastal flooding.
New Jersey Snowfall Totals
Individual Snowfall Totals from March 2-3, 1994
Table of Contents
Storm Summary
Regional Surface Observations
Satellite Imagery
Sea Level Pressure and 1000 to 500 Millibar Thickness Maps
850 Millibar Maps
700 Millibar Maps
500 Millibar Maps
300 Millibar Maps
200 Millibar Maps
Snow storm, December 29-30, 1993
Ice storm, January 3-4, 1994
Ice storm, January 7-8, 1994
Snow and ice storm, January 17-18, 1994
Snow storm, January 25-26, 1994
Snow and ice storm, February 8-9, 1994
Snow and ice storm, February 11, 1994
Snow and ice storm, February 23-24, 1994
Snow and ice storm, March 2-3, 1994
Snow storm, March 18, 1994
Back to Ray's Winter Storm Archive
Copyright © 2012 by Raymond C Martin Jr. All rights reserved