

Storm description, surface observations, snowfall totals, and images courtesy of the National Climatic Data Center, the National Centers of Environmental Prediction, the Climate Prediction Center, the Hydrometeorological Prediction Center, the Mount Holly National Weather Service Office, the Upton National Weather Service Office, Rutgers University, Plymouth State University, the University of Illinois, the American Meteorological Society, Weather Graphics Technologies, AccuWeather, and the Weather Channel.
Table of Contents
Storm Summary
Regional Surface Observations
Satellite Imagery
Sea Level Pressure and 1000 to 500 Millibar Thickness Maps
850 Millibar Maps
700 Millibar Maps
500 Millibar Maps
300 Millibar Maps
200 Millibar Maps
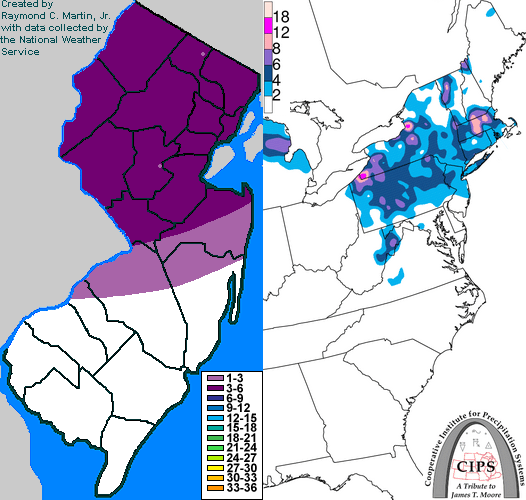
Contoured Snowfall Totals from March 18, 1994
STORM DESCRIPTION
A fast moving Alberta Clipper brought the last snowstorm of the season to central and northern New Jersey.
Synoptic Discussion
A low pressure system dove southeastward out of south-central Canada into the northern Plains states during the day on the 17th. It turned eastward during the night of the 17th, moving across the Mississippi Valley, and then pushed east across the Ohio Valley and Mid-Atlantic during the day on the 18th. By early on the 19th, the low pressure had moved out over the Atlantic Ocean.
Local Discussion
Precipitation spread from west to east across the state during the midday hours of the 18th. Across northern and central New Jersey, precipitation was primarily in the form of snow, and came down at a moderate to heavy rate for a time. Across southern New Jersey, precipitation was much more spotty and light, while the air was warm enough to allow the snow to mix with rain. Precipitation ended from west to east during the evening hours of the 18th. Accumulations ranged from 2 to 5 inches across central and northern New Jersey, with only a trace to 2 inches falling across southern New Jersey.
New Jersey Snowfall Totals
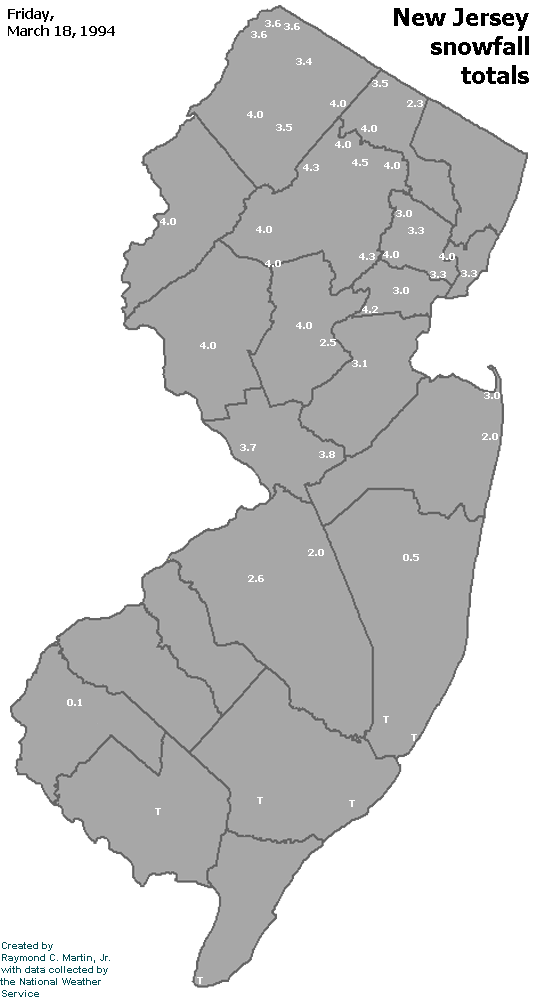
Individual Snowfall Totals from March 18, 1994
Table of Contents
Storm Summary
Regional Surface Observations
Satellite Imagery
Sea Level Pressure and 1000 to 500 Millibar Thickness Maps
850 Millibar Maps
700 Millibar Maps
500 Millibar Maps
300 Millibar Maps
200 Millibar Maps
Snow storm, December 29-30, 1993
Ice storm, January 3-4, 1994
Ice storm, January 7-8, 1994
Snow and ice storm, January 17-18, 1994
Snow storm, January 25-26, 1994
Snow and ice storm, February 8-9, 1994
Snow and ice storm, February 11, 1994
Snow and ice storm, February 23-24, 1994
Snow and ice storm, March 2-3, 1994
Snow storm, March 18, 1994
Back to Ray's Winter Storm Archive
Copyright © 2012 by Raymond C Martin Jr. All rights reserved