

Storm description, surface observations, snowfall totals, and images courtesy of the National Climatic Data Center, the National Centers of Environmental Prediction, the Climate Prediction Center, the Hydrometeorological Prediction Center, the Mount Holly National Weather Service Office, the Upton National Weather Service Office, Rutgers University, Plymouth State University, the University of Illinois, the American Meteorological Society, Weather Graphics Technologies, AccuWeather, and the Weather Channel.
Table of Contents
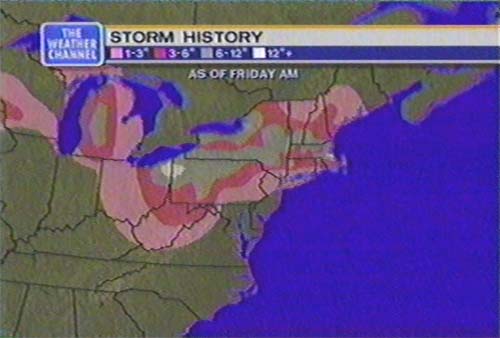
Storm Summary
Regional Surface Observations
National Weather Service Forecasts
Surface Maps
Satellite Imagery
Sea Level Pressure and 1000 to 500 Millibar Thickness Maps
850 Millibar Maps
700 Millibar Maps
500 Millibar Maps
300 Millibar Maps
200 Millibar Maps
National Radar Imagery
Local Radar Imagery
Fort Dix Doppler Radar Imagery
Storm Photos
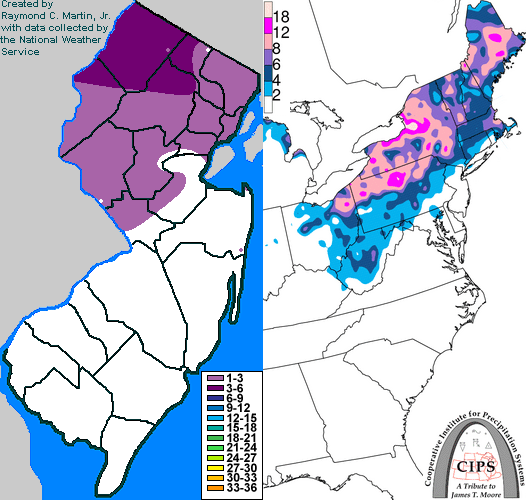
Contoured Snowfall Totals from January 13-15, 1999
STORM DESCRIPTION
A very protracted winter storm affected most of New Jersey from the 13th through the 15th, bringing a combination of snow, sleet, and freezing rain to most of the state.
Synoptic Discussion
A cold front passed through the Northeast on the afternoon and evening of the 13th. Northeast winds allowed an extremely cold and shallow air mass to move south behind it. Unlike the usual pattern with cold frontal passages, precipitation occured behind the front and slowly worked its way southward during the late eveing of the 13th and early morning of the 14th. A very strong high pressure built into northern New England on the 14th. A weak low pressure developed on the front in the Tennessee Valley on the 14th, but weakened as it moved east off the Delmarva Peninsula during the evening of the 14th. The high moved offshore the evening of the 14th and the flow across the Middle Atlantic states became more easterly. This permitted warmer air to flow back into the region, especially at mid-levels, during the late afternoon and evening of the 14th just as a second and stronger low pressure system was getting organized in the Tennessee Valley. A secondary low formed near Norfolk during the early morning of the 15th and this not only accelerated the increase in warm air but also intensified precipitation. By late on the 15th, the low pressure system had sped northeastwards to Nova Scotia.
Local Discusion
After the initial cold frontal passage, temperatures dropped from the 50's to the 20's in a matter of hours across most of the state. Precipitation started as sleet and snow in northwest New Jersey, but started as either freezing rain or sleet further south. During the day on the 14th, the cold air became deep enough for precipitation to fall mainly as snow or sleet across northern and central New Jersey. While sleet mixed with the rain across southeastern New Jersey, temperatures remained above freezing. During the afternoon and evening of the 14th, the transition back to freezing rain started, first around the Philadelphia suburbs and in Ocean and Monmouth counties around 4 pm EST and spreading northwest through the state by midnight. Enough warm air moved in to change the freezing rain to rain across southwest and east central New Jersey between 1 am and 4 am EST on the 15th, just as the heavy precipitation moved in. The change to plain rain occured around 6 am EST in the Trenton area and between 7 am and 9 am EST across most of northwest New Jersey. Precipitation changed back to snow as it ended in Sussex County. Snow and sleet accumulations ranged from 2 to 5 inches in northwestern New Jersey and up to two inches in central New Jersey. Ice accrual reached 1 inch in northwest New Jersey and one-half inch in central New Jersey, while areas futher south recieved one-quarter inch or less. Total rainfall equivalents averaged between 1 and 2 inches.
New Jersey Snowfall Totals
Individual Snowfall Totals from January 13-15, 1999
Regional Snowfall Totals
Snowfall totals as of 1500Z 15 January 1999 (10AM EST 15 January 1999)
Table of Contents
Storm Summary
Regional Surface Observations
National Weather Service Forecasts
Surface Maps
Satellite Imagery
Sea Level Pressure and 1000 to 500 Millibar Thickness Maps
850 Millibar Maps
700 Millibar Maps
500 Millibar Maps
300 Millibar Maps
200 Millibar Maps
National Radar Imagery
Local Radar Imagery
Fort Dix Doppler Radar Imagery
Storm Photos
Snow storm, December 23-24, 1998
Snow and ice storm, January 8-9, 1999
Ice storm, January 13-15, 1999
Snow storm, March 14-15, 1999
Back to Ray's Winter Storm Archive
Copyright © 2012 by Raymond C Martin Jr. All rights reserved