

Storm description, surface observations, snowfall totals, and images courtesy of the National Climatic Data Center, the National Centers of Environmental Prediction, the Climate Prediction Center, the Hydrometeorological Prediction Center, the Mount Holly National Weather Service Office, the Upton National Weather Service Office, Rutgers University, Plymouth State University, the University of Illinois, the American Meteorological Society, Weather Graphics Technologies, AccuWeather, and the Weather Channel.
Table of Contents
Storm Summary
Regional Surface Observations
Satellite Imagery
National Surface Weather Maps - Pressure and Fronts Only
Sea Level Pressure and 1000 to 500 Millibar Thickness Maps
850 Millibar Maps
700 Millibar Maps
500 Millibar Maps
300 Millibar Maps
200 Millibar Maps
National Radar Imagery
Fort Dix Doppler Radar Imagery
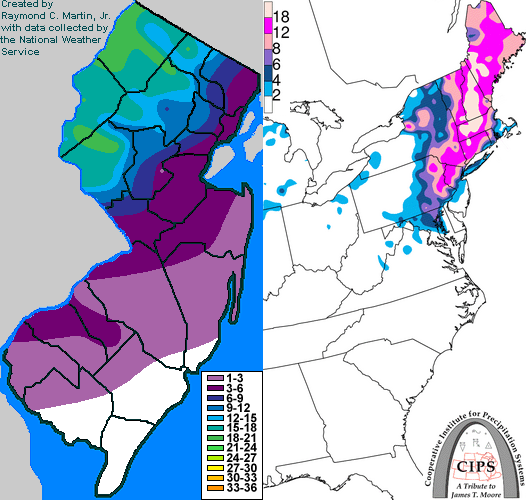
Contoured Snowfall Totals from February 5, 2001
STORM DESCRIPTION
An intensifying low pressure that helped generate its own cold air produced heavy snow over most of northern New Jersey and accumulating snow as far south as southwestern New Jersey.
Synoptic Discussion
The low pressure developed along a stationary front just east of Florida on the 4th. By the morning of the 5th, it moved northeast to near Elizabeth City, North Carolina. It then intensified rapidly (25 millibars in 24 hours) as it moved northeast, reaching Long Island on the evening of the 5th and Nova Scotia on the morning of the 6th.
Local Discussion
Precipitation moved into New Jersey around 2am EST on the 5th. Temperatures were cold enough in Sussex, Warren, Morris and northern Passaic counties so that precipitation started as snow, while across the rest of the state it began as rain. As the morning progressed, the intense precipitation caused temperatures to cool as snow aloft melted into rain, which absorbed atmospheric heat in the melting process. This caused the rain/snow line to progress slowly but steadily southeastwards through the morning and afternoon hours. Precipitation had changed to snow by 10am EST on the 5th in Somerset, Hunterdon, western Union, western Essex, southern Passaic, and northern Bergen counties, by 11am EST on the 5th in southern Bergen, Hudson, eastern Essex, eastern Union, Middlesex, and Mercer counties, and by 1pm EST on the 5th in Monmouth, northwestern Burlington, Camden, and Gloucester counties. The heaviest snow fell between 1pm EST and 5pm EST on the 5th in northern sections and more briefly around 3 pm EST on the 5th in southern sections. Accumulations were 16 to 20 inches in Warren and Sussex counties, 10 to 18 inches in Huterdon, Morris, and northern Passaic counties, 6 to 12 inches in Bergen, southern Passaic, Essex, western Union, and Somerset counties, 3 to 6 inches in Hudson, eastern Union, Middlesex and Mercer counties, and 1 to 4 inches in Monmouth, northwestern Burlington, Camden, and Gloucester counties.
New Jersey Snowfall Totals
Individual Snowfall Totals from February 5, 2001
Regional Snowfall Totals
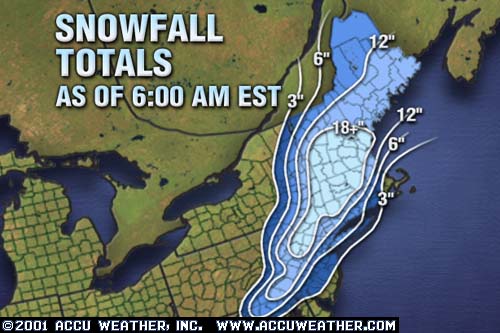
Snowfall Totals from 1100Z 06 February 2001 (6AM EST 06 February 2001)
Table of Contents
Storm Summary
Regional Surface Observations
Satellite Imagery
National Surface Weather Maps - Pressure and Fronts Only
Sea Level Pressure and 1000 to 500 Millibar Thickness Maps
850 Millibar Maps
700 Millibar Maps
500 Millibar Maps
300 Millibar Maps
200 Millibar Maps
National Radar Imagery
Fort Dix Doppler Radar Imagery
Snow storm, December 19-20, 2000
Snow storm, December 22, 2000
Snow storm, December 30, 2000
Snow storm, January 5, 2001
Snow and ice storm, January 20-21, 2001
Snow storm, February 5, 2001
Snow storm, February 22, 2001
Snow and ice storm, March 4-6, 2001
Back to Ray's Winter Storm Archive
Copyright © 2012 by Raymond C Martin Jr. All rights reserved