

Storm description, surface observations, snowfall totals, and images courtesy of the National Climatic Data Center, the National Centers of Environmental Prediction, the Climate Prediction Center, the Hydrometeorological Prediction Center, the Mount Holly National Weather Service Office, the Upton National Weather Service Office, Rutgers University, Plymouth State University, the University of Illinois, the American Meteorological Society, Weather Graphics Technologies, AccuWeather, and the Weather Channel.
Table of Contents
Storm Summary
Regional Surface Observations
Satellite Imagery
National Surface Weather Maps - Pressure and Fronts Only
Sea Level Pressure and 1000 to 500 Millibar Thickness Maps
850 Millibar Maps
700 Millibar Maps
500 Millibar Maps
300 Millibar Maps
200 Millibar Maps
National Radar Imagery
Fort Dix Doppler Radar Imagery
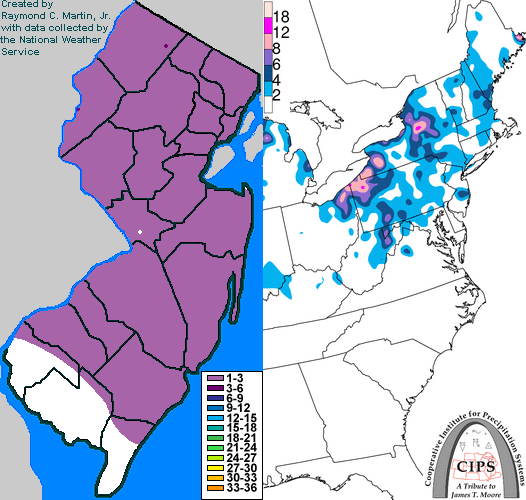
Contoured Snowfall Totals from January 5, 2001
STORM DESCRIPTION
A storm system moving across southern Canada brought a few inches of snow across most of the state.
Synoptic Discussion
The storm system responsible for the snow moved southeastward across Canada on the 4th and the 5th. By noon EST on the 5th, the center of low pressure was in southern Ontario. During the next 12 hours, a deepening trough of upper-level low pressure moved southeastward well ahead of the surface storm, causing a new storm to begin forming just off the Mid-Atlantic coast. Both systems continued moving east to southeast and had passed the state by midnight on the 6th.
Local Discussion
Snow advanced across the state between 11AM and 1PM ESt on the 5th. In the northern and central two-thirds of the state, the snow was mostly continuous, while in the southern one-third, the snow moved through in two bands: the first between noon and 2PM EST, and the second between 4PM and 7PM EST. All snow departed the state by 8PM EST on the 5th. Snowfall accumulations were light, ranging from a coating in far southern and southwestern parts of New Jersey to 3 inches in the northwestern mountains. Temperatures were near to just above freezing, which helped to minimize accumulations.
New Jersey Snowfall Totals
Individual Snowfall Totals from January 5, 2001
Table of Contents
Storm Summary
Regional Surface Observations
Satellite Imagery
National Surface Weather Maps - Pressure and Fronts Only
Sea Level Pressure and 1000 to 500 Millibar Thickness Maps
850 Millibar Maps
700 Millibar Maps
500 Millibar Maps
300 Millibar Maps
200 Millibar Maps
National Radar Imagery
Fort Dix Doppler Radar Imagery
Snow storm, December 19-20, 2000
Snow storm, December 22, 2000
Snow storm, December 30, 2000
Snow storm, January 5, 2001
Snow and ice storm, January 20-21, 2001
Snow storm, February 5, 2001
Snow storm, February 22, 2001
Snow and ice storm, March 4-6, 2001
Back to Ray's Winter Storm Archive
Copyright © 2012 by Raymond C Martin Jr. All rights reserved