

Table of Contents
Storm Summary
Regional Surface Observations
National Weather Service Forecasts
Surface Maps
Satellite Imagery
National Surface Weather Maps - Pressure and Fronts Only
Continental Surface Weather Maps - Pressure and Fronts Only
Sea Level Pressure and 1000 to 500 Millibar Thickness Maps
850 Millibar Maps
700 Millibar Maps
500 Millibar Maps
300 Millibar Maps
200 Millibar Maps
National Radar Imagery
Regional Radar Imagery
Fort Dix Doppler Radar Imagery
Storm Photos
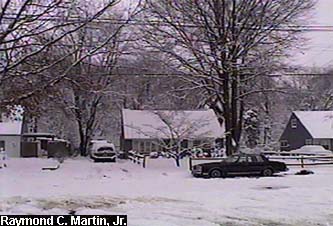
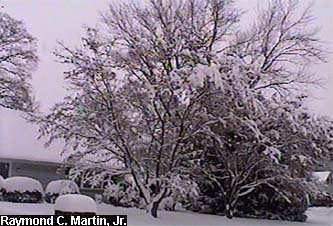
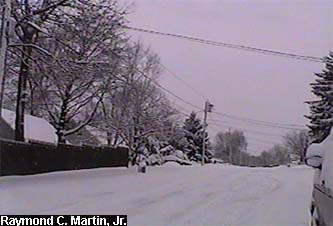
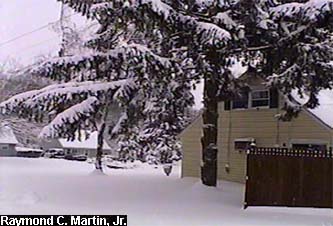
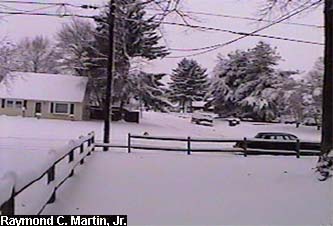
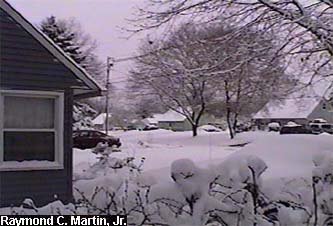
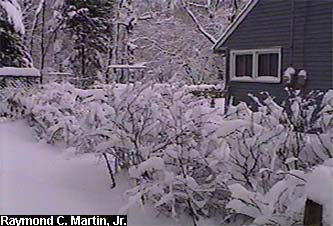
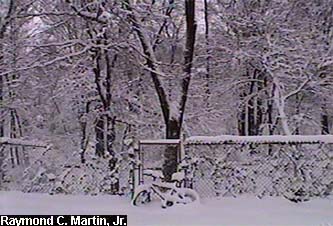
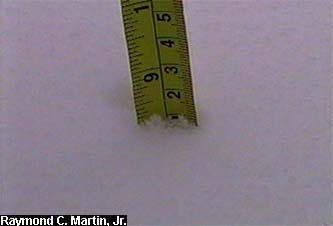
STORM PHOTOS
The following pictures were taken with my grandparents' camcorder around my hometown of Ewing, New Jersey at around 2PM EST December 6, 2003. 8.3 inches accumulated by the end of the storm in Ewing.
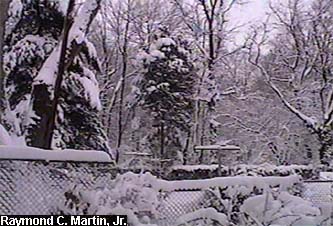
The following pictures were taken with my grandparents' camcorder as I walked through the woods along the Shabukunk Creek between Terrace Boulevard and Broad Avenue at around 2PM EST December 6, 2003.
Heading south from the Rutledge Avenue footbridge
Heading north from the Central Avenue bridge
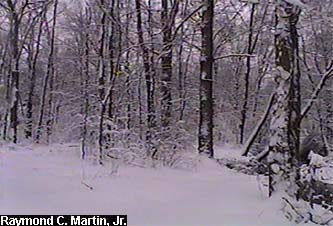
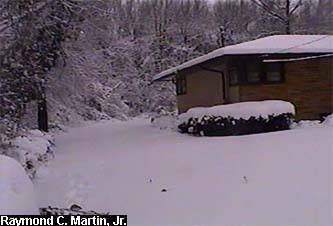
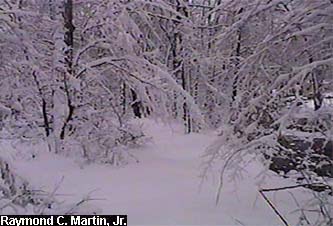
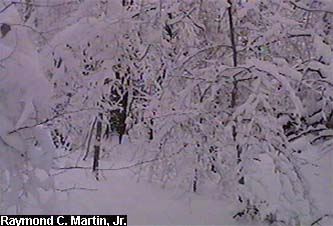
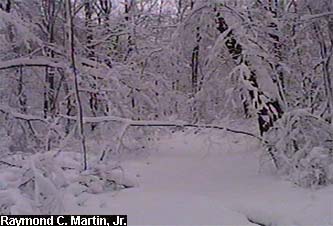
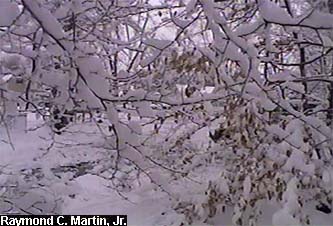
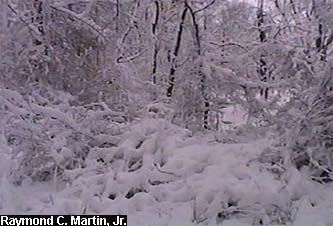
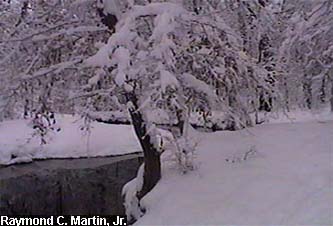
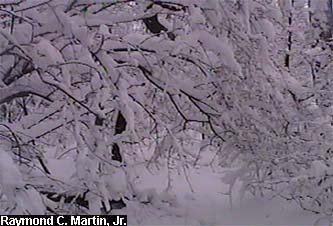
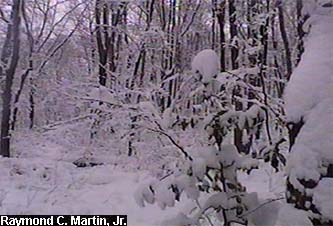
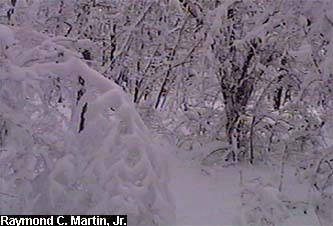
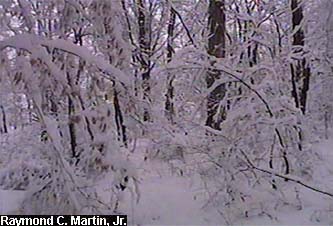
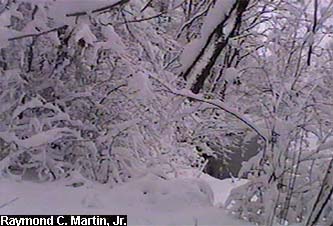
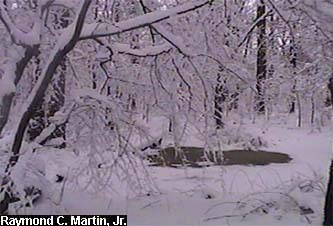
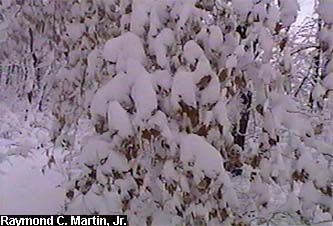
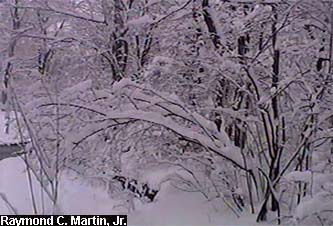
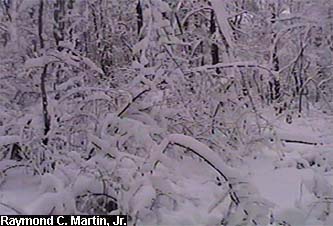
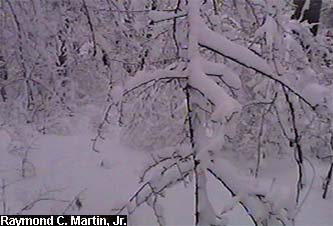
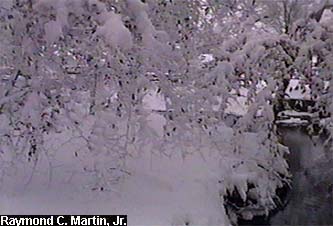
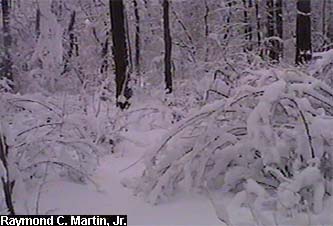
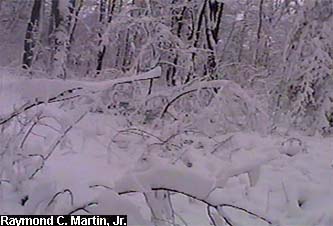
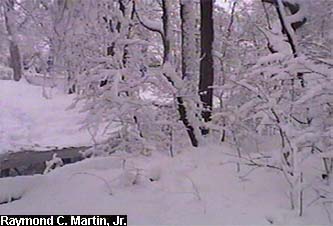
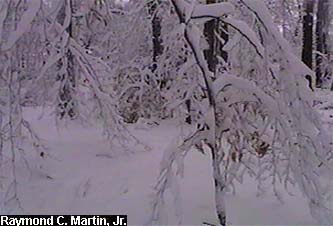
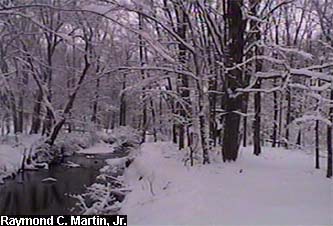
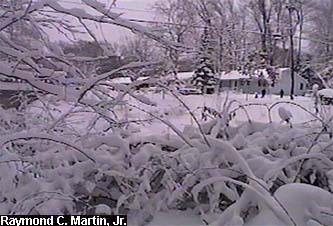
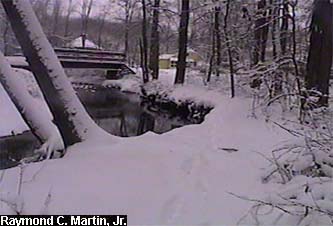
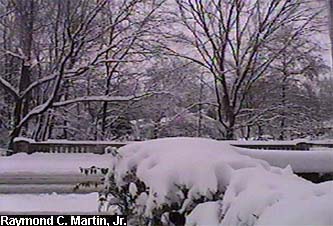
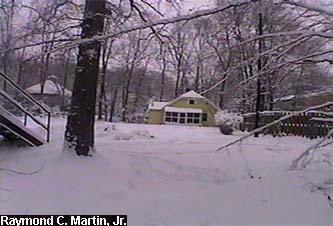
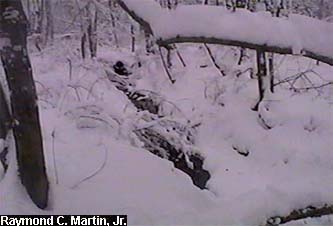
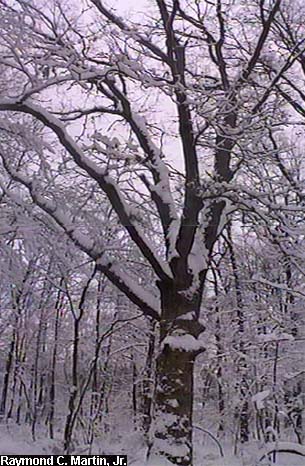
Table of Contents
Storm Summary
Regional Surface Observations
National Weather Service Forecasts
Surface Maps
Satellite Imagery
National Surface Weather Maps - Pressure and Fronts Only
Continental Surface Weather Maps - Pressure and Fronts Only
Sea Level Pressure and 1000 to 500 Millibar Thickness Maps
850 Millibar Maps
700 Millibar Maps
500 Millibar Maps
300 Millibar Maps
200 Millibar Maps
National Radar Imagery
Regional Radar Imagery
Fort Dix Doppler Radar Imagery
Storm Photos
Snow storm, December 14-15, 2003
Snow storm, January 14-15, 2004
Snow and ice storm, January 17-18, 2004
Snow storm, January 26, 2004
Snow and ice storm, January 27-28, 2004
Snow and ice storm, March 16-17, 2004
Snow storm, March 18-19, 2004
Back to Ray's Winter Storm Archive