

Storm description, surface observations, snowfall totals, and images courtesy of the National Climatic Data Center, the National Centers of Environmental Prediction, the Climate Prediction Center, the Hydrometeorological Prediction Center, the Mount Holly National Weather Service Office, the Upton National Weather Service Office, Rutgers University, Plymouth State University, the University of Illinois, the American Meteorological Society, Weather Graphics Technologies, AccuWeather, and the Weather Channel.
Table of Contents
Storm Summary
Regional Surface Observations
National Weather Service Forecasts
Surface Maps
Satellite Imagery
National Surface Weather Maps - Pressure and Fronts Only
Continental Surface Weather Maps - Pressure and Fronts Only
Sea Level Pressure and 1000 to 500 Millibar Thickness Maps
850 Millibar Maps
700 Millibar Maps
500 Millibar Maps
300 Millibar Maps
200 Millibar Maps
National Radar Imagery
Regional Radar Imagery
Fort Dix Doppler Radar Imagery
Storm Photos
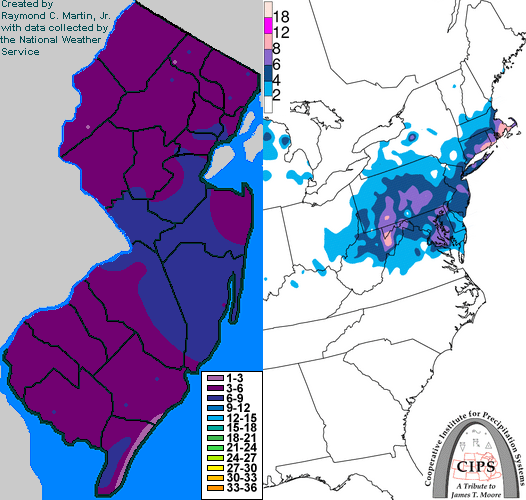
Contoured Snowfall Totals from February 24-25, 2005
STORM DESCRIPTION
A wave of low pressure moving east-northeast across the southeastern United States brought the second snowstorm in four days to New Jersey.
Synoptic Discussion
Cold and dry arctic high pressure built southward across the Northeast from southeastern Canada on the 23rd and 24th. Meanwhile, a wave of low pressure developed along a stationary front in the lower Mississippi Valley on the evening of the 23rd. It moved east-northeast and reached Georgia by the morning of the 24th. It then redeveloped near Cape Hatteras by the evening of the 24th and continued moving east-northeast. By the morning of the 25th it was southeast of Cape Cod.
Local Discussion
Snow spread slowly across the state from southwest to northeast during the day on the 24th. The snow was impeded by the very dry air moving southward across the state due to the strong high pressure in southeastern Canada. The snow became moderate to occasionally heavy during the afternoon of the 24th as a strong upper-level jet streak moved by to the north, and then again just after midnight on the 25th as the upper-level trough moved across the state. There was enough influence from the warmer ocean to cause the snow to mix with and change to sleet and rain along the southeast coast during the afternoon and evening of the 24th. The rain and sleet changed back to snow after midnight on the 25th. The snow tapered off from west to east state-wide during the early morning hours of the 25th. Snowfall accumulations ranged from 3 to 8 inches in Atlantic and Ocean counties, 2 to 8 inches in Cape May county, 6 to 7 inches in Mercer County, 5 to 7 inches in Monmouth, Middlesex, Union and Passaic counties, 4 to 7 inches in Essex and Hudson counties, 3 to 7 inches in Morris County, 5 to 6 inches in Somerset, Burlington and Camden counties, 4 to 6 inches in Bergen, Hunterdon and Cumberland counties, 3 to 6 inches in Gloucester County, 3 to 4 inches in Sussex and Salem counties, and 2 to 4 inches in Warren County.
New Jersey Snowfall Totals
Individual Snowfall Totals from February 24-25, 2005
Table of Contents
Storm Summary
Regional Surface Observations
National Weather Service Forecasts
Surface Maps
Satellite Imagery
National Surface Weather Maps - Pressure and Fronts Only
Continental Surface Weather Maps - Pressure and Fronts Only
Sea Level Pressure and 1000 to 500 Millibar Thickness Maps
850 Millibar Maps
700 Millibar Maps
500 Millibar Maps
300 Millibar Maps
200 Millibar Maps
National Radar Imagery
Regional Radar Imagery
Fort Dix Doppler Radar Imagery
Storm Photos
Snow storm, December 26-27, 2004
Snow storm, January 19, 2005
Snow storm, January 22-23, 2005
Snow storm, February 20-21, 2005
Snow storm, February 24-25, 2005
Snow storm, February 28-March 1, 2005
Snow storm, March 8, 2005
Back to Ray's Winter Storm Archive
Copyright © 2012 by Raymond C Martin Jr. All rights reserved