

Storm description, surface observations, snowfall totals, and images courtesy of the National Climatic Data Center, the National Centers of Environmental Prediction, the Climate Prediction Center, the Hydrometeorological Prediction Center, the Mount Holly National Weather Service Office, the Upton National Weather Service Office, Rutgers University, Plymouth State University, the University of Illinois, the American Meteorological Society, Weather Graphics Technologies, AccuWeather, and the Weather Channel.
Table of Contents
Storm Summary
Regional Surface Observations
National Weather Service Forecasts
Surface Maps
Satellite Imagery
National Surface Weather Maps - Pressure and Fronts Only
Continental Surface Weather Maps - Pressure and Fronts Only
Sea Level Pressure and 1000 to 500 Millibar Thickness Maps
850 Millibar Maps
700 Millibar Maps
500 Millibar Maps
300 Millibar Maps
200 Millibar Maps
National Radar Imagery
Regional Radar Imagery
Fort Dix Doppler Radar Imagery
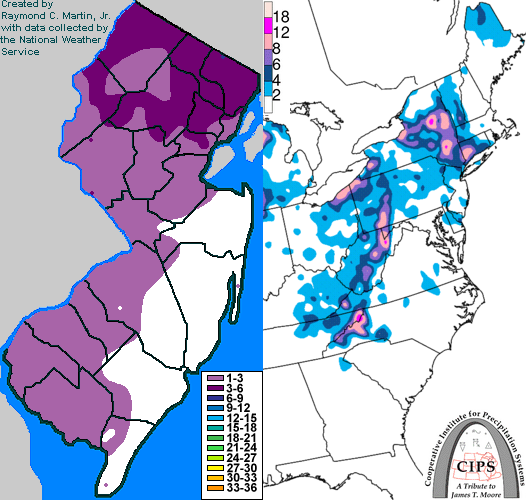
Contoured Snowfall Totals from January 7, 2011
STORM DESCRIPTION
A relatively weak cold front brought a few inches of snow to parts of New Jersey.
Synoptic Discussion
The low pressure system associated with the cold front entered North Dakota from Canada on the evening of January 4th. By the morning of the 5th it was crossing into Minnesota, and by the evening of the 5th it was over the western end of Lake Superior. By the morning of the 6th it was over the eastern end of Lake Superior and by the evening of the 6th it had reached Lake Huron. On the morning of the 7th it was over southeastern Ontario. By the evening of the 7th the entire system had begun to dissipate.
Local Discussion
Light to moderate snow overspread New Jersey from west to east during the early morning hours of the 7th. It continued until gradually tapering off from west to east during the midday hours. Snowfall accumulations ranged from 2 to 6 inches in Bergen, Passaic and Sussex counties, 1 to 4 inches in Essex, Hudson, Hunterdon, Morris, Somerset, Union and Warren counties, and a coating to 2 inches in Atlantic, Burlington, Camden, Cape May, Cumberland, Gloucester, Mercer, Middlesex, Monmouth, Ocean and Salem counties.
New Jersey Snowfall Totals
Individual Snowfall Totals from January 7, 2011
Table of Contents
Storm Summary
Regional Surface Observations
National Weather Service Forecasts
Surface Maps
Satellite Imagery
National Surface Weather Maps - Pressure and Fronts Only
Continental Surface Weather Maps - Pressure and Fronts Only
Sea Level Pressure and 1000 to 500 Millibar Thickness Maps
850 Millibar Maps
700 Millibar Maps
500 Millibar Maps
300 Millibar Maps
200 Millibar Maps
National Radar Imagery
Regional Radar Imagery
Fort Dix Doppler Radar Imagery
Snow storm, December 26-27, 2010
Snow storm, January 7, 2011
Snow storm, January 8, 2011
Snow storm, January 11-12, 2011
Snow and ice storm, January 17-18, 2011
Snow storm, January 21, 2011
Snow and ice storm, January 26-27, 2011
Snow storm, February 21-22, 2011
Back to Ray's Winter Storm Archive
Copyright © 2011 by Raymond C Martin Jr. All rights reserved