

Storm description, surface observations, snowfall totals, and images courtesy of the National Climatic Data Center, the National Centers of Environmental Prediction, the Climate Prediction Center, the Hydrometeorological Prediction Center, the Mount Holly National Weather Service Office, the Upton National Weather Service Office, Rutgers University, Plymouth State University, the University of Illinois, the American Meteorological Society, Weather Graphics Technologies, AccuWeather, and the Weather Channel.
Table of Contents
Storm Summary
Regional Surface Observations
National Weather Service Forecasts
Surface Maps
Satellite Imagery
National Surface Weather Maps - Pressure and Fronts Only
Continental Surface Weather Maps - Pressure and Fronts Only
Sea Level Pressure and 1000 to 500 Millibar Thickness Maps
850 Millibar Maps
700 Millibar Maps
500 Millibar Maps
300 Millibar Maps
200 Millibar Maps
National Radar Imagery
Regional Radar Imagery
Fort Dix Doppler Radar Imagery
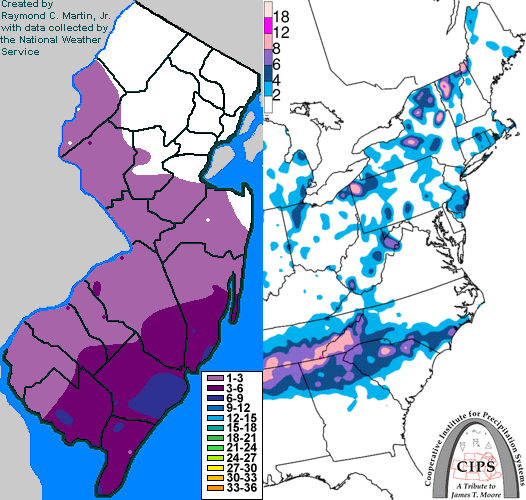
Contoured Snowfall Totals from January 8, 2011
STORM DESCRIPTION
A strengthening storm system brought moderate snowfall to parts of southern New Jersey, with lighter amounts elsewhere.
Synoptic Discussion
The low pressure system ultimately responsible for the snowfall entered North Dakota from southern Canada on the evening of January 6th. It reached northern Illinois by the morning of the 7th, and was in western Virginia by the evening of the 7th. By the morning of the 8th it was over extreme southeastern Maryland. By this time it began to strengthen, and was 10 millibars deeper by the evening of the 8th by which time it had reached the open waters south of Cape Cod. By the morning of the 9th it had continued to deepen but was located just southeast of Nova Scotia.
Local Discussion
Snow overspread southern New Jersey around dawn on January 8th. It became heavy at times over southern New Jersey during the morning hours of the 8th, but was generally light to moderate elsewhere. The snow had great difficulty spreading northeast and did not reach northeastern New Jersey until the late afternoon hours on the 8th. Snow ended by early evening across the state. Snowfall amounts were highest in southern New Jersey, with totals ranging from 2 to 8 inches in Atlantic, Cape May, Cumberland and Ocean counties, 1 to 4 inches in Burlington, Camden, Gloucester, Hunterdon, Mercer and Salem counties, a coating to 2 inches in Middlesex, Monmouth, Somerset and Warren counties, and less than an inch in Bergen, Essex, Hudson, Morris, Passaic, Sussex and Union counties.
New Jersey Snowfall Totals
Individual Snowfall Totals from January 8, 2011
Table of Contents
Storm Summary
Regional Surface Observations
National Weather Service Forecasts
Surface Maps
Satellite Imagery
National Surface Weather Maps - Pressure and Fronts Only
Continental Surface Weather Maps - Pressure and Fronts Only
Sea Level Pressure and 1000 to 500 Millibar Thickness Maps
850 Millibar Maps
700 Millibar Maps
500 Millibar Maps
300 Millibar Maps
200 Millibar Maps
National Radar Imagery
Regional Radar Imagery
Fort Dix Doppler Radar Imagery
Snow storm, December 26-27, 2010
Snow storm, January 7, 2011
Snow storm, January 8, 2011
Snow storm, January 11-12, 2011
Snow and ice storm, January 17-18, 2011
Snow storm, January 21, 2011
Snow and ice storm, January 26-27, 2011
Snow storm, February 21-22, 2011
Back to Ray's Winter Storm Archive
Copyright © 2011 by Raymond C Martin Jr. All rights reserved