

Storm description, surface observations, snowfall totals, and images courtesy of the National Climatic Data Center, the National Centers of Environmental Prediction, the Climate Prediction Center, the Hydrometeorological Prediction Center, the Mount Holly National Weather Service Office, the Upton National Weather Service Office, Rutgers University, Plymouth State University, the University of Illinois, the American Meteorological Society, Weather Graphics Technologies, AccuWeather, and the Weather Channel.
Table of Contents
Storm Summary
Regional Surface Observations
National Weather Service Forecasts
Surface Maps
Satellite Imagery
National Surface Weather Maps - Pressure and Fronts Only
Continental Surface Weather Maps - Pressure and Fronts Only
Sea Level Pressure and 1000 to 500 Millibar Thickness Maps
850 Millibar Maps
700 Millibar Maps
500 Millibar Maps
300 Millibar Maps
200 Millibar Maps
National Radar Imagery
Regional Radar Imagery
Fort Dix Doppler Radar Imagery
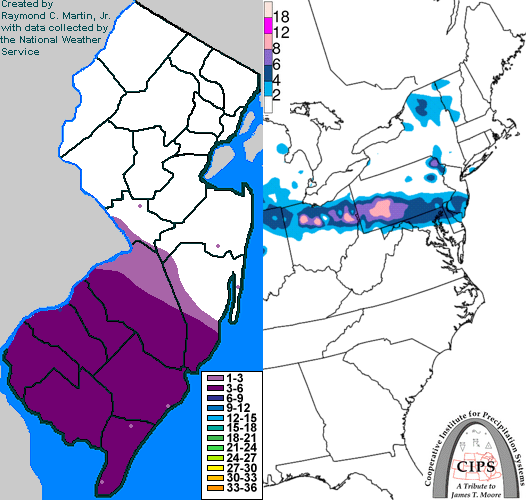
Contoured Snowfall Totals from February 21-22, 2011
STORM DESCRIPTION
A weak wave of low pressure brought one more round of snow to central and southern New Jersey.
Synoptic Discussion
The surface low ultimately responsible for this snowstorm came ashore in California during the evening of February 18th. By the morning of the 19th the low had moved into the Great Basin of Nevada and by the evening of the 19th it had moved across much of Utah. Early on the 20th the low pressure was located in eastern Colorado and by that evening it had moved across Nebraska and into Iowa. By the morning of the 21st the low had entered Illinois, and by the evening that day it had entered northern Kentucky. By the early morning of the 22nd the system had dropped southeastward into North Carolina, and by the evening of the 22nd the low was pushing south into southern South Carolina. By the morning of the 23rd it was east of northern Florida.
Local Discussion
Snow overspread much of southern New Jersey during the evening hours of the 21st, but had great difficulty pushing further north due to a very cold and dry high pressure system located in southern Canada. While snow fell heavy at times in parts of southern New Jersey during the late evening and early overnight hours, only light fell snow in central New Jersey with no snow at all in much of northern New Jersey. The snow departed the state from northwest to southeast before dawn on the 22nd. Snowfall accumulations were greatest in southern New Jersey, with totals ranging from 2 to 6 inches in Atlantic, Burlington, Camden, Cape May, Cumberland and Salem counties, a coating to 4 inches in Ocean County, a coating to 1 inch in Mercer and Monmouth counties, a trace to a coating in Hunterdon, Middlesex, Monmouth, Somerset and Warren counties, and a trace or less further north and east.
New Jersey Snowfall Totals
Individual Snowfall Totals from February 21-22, 2011
Table of Contents
Storm Summary
Regional Surface Observations
National Weather Service Forecasts
Surface Maps
Satellite Imagery
National Surface Weather Maps - Pressure and Fronts Only
Continental Surface Weather Maps - Pressure and Fronts Only
Sea Level Pressure and 1000 to 500 Millibar Thickness Maps
850 Millibar Maps
700 Millibar Maps
500 Millibar Maps
300 Millibar Maps
200 Millibar Maps
National Radar Imagery
Regional Radar Imagery
Fort Dix Doppler Radar Imagery
Snow storm, December 26-27, 2010
Snow storm, January 7, 2011
Snow storm, January 8, 2011
Snow storm, January 11-12, 2011
Snow and ice storm, January 17-18, 2011
Snow storm, January 21, 2011
Snow and ice storm, January 26-27, 2011
Snow storm, February 21-22, 2011
Back to Ray's Winter Storm Archive
Copyright © 2011 by Raymond C Martin Jr. All rights reserved