

Storm description, surface observations, snowfall totals, and images courtesy of the National Climatic Data Center, the National Centers of Environmental Prediction, the Climate Prediction Center, the Hydrometeorological Prediction Center, the Mount Holly National Weather Service Office, the Upton National Weather Service Office, Rutgers University, Plymouth State University, the University of Illinois, the American Meteorological Society, Weather Graphics Technologies, AccuWeather, and the Weather Channel.
Table of Contents
Storm Summary
Regional Surface Observations
National Weather Service Forecasts
Surface Maps
Satellite Imagery
National Surface Weather Maps - Pressure and Fronts Only
Continental Surface Weather Maps - Pressure and Fronts Only
Sea Level Pressure and 1000 to 500 Millibar Thickness Maps
850 Millibar Maps
700 Millibar Maps
500 Millibar Maps
300 Millibar Maps
200 Millibar Maps
National Radar Imagery
Regional Radar Imagery
Fort Dix Doppler Radar Imagery
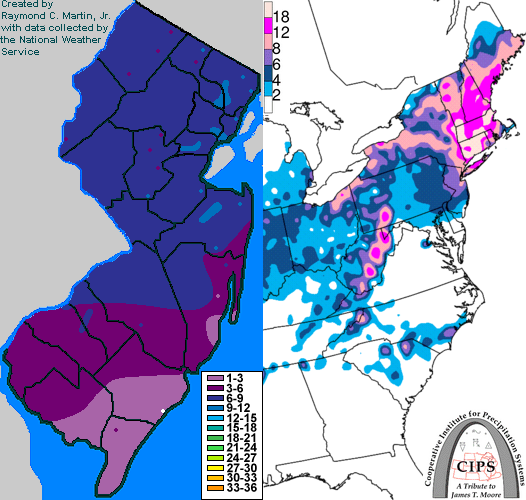
Contoured Snowfall Totals from January 11-12, 2011
STORM DESCRIPTION
A rapidly strengthening storm system brought a significant snowstorm to much of New Jersey.
Synoptic Discussion
Two low pressure systems converged to produce this winter storm. The first developed in far southern Texas during the morning of January 9th. This low moved east and was located in the northern Gulf of Mexico near Louisiana by the evening of the 9th. By the morning of the 10th, this low had continued east and was located just south of far western Florida. Around this time the second low began to develop in Nebraska. By the evening of the 10th, the first low was near the extreme northeastern Gulf coast, while the second low had reached Missouri. During the night both lows continued moving east, and by the morning of the 11th the first low was off the Carolina coast while the second low was in Illinois. By the evening of the 11th the first low had reached Cape Hatteras, while the second low was over Lake Erie. From here the lows rapidly moved towards southern New England and intensified, with a single much stronger low pressure located over Rhode Island by the morning of the 12th. The low reached the Gulf of Maine by the evening of the 12th.
Local Discussion
Precipitation overspread New Jersey from west to east during the early evening of the 11th. Warm temperatures at the surface and aloft caused the precipitation to mix with sleet, freezing rain and rain at the onset across parts of southern and eastern New Jersey, but precipitation was snow from the start further north and west. As the low pressure strengthened, cold air was wrapped south across the state and precipitation changed over to snow everywhere by the late evening hours. The snow became heavy at times during the overnight hours across northeastern New Jersey, with somewhat lighter snowfall rates elsewhere. Precipitation ended from southwest to northeast between midnight and dawn on the 12th. Total accumulations were heaviest in northeastern New Jersey, ranging from 5 to 11 inches in Bergen, Middlesex, Monmouth and Passaic counties, 3 to 9 inches in Burlington, Camden, Essex, Gloucester, Hudson, Hunterdon, Mercer, Morris, Ocean, Somerset, Sussex, Union and Warren counties, and 1 to 5 inches in Atlantic, Cape May, Cumberland and Salem counties.
New Jersey Snowfall Totals
Individual Snowfall Totals from January 11-12, 2011
Regional Snowfall Totals
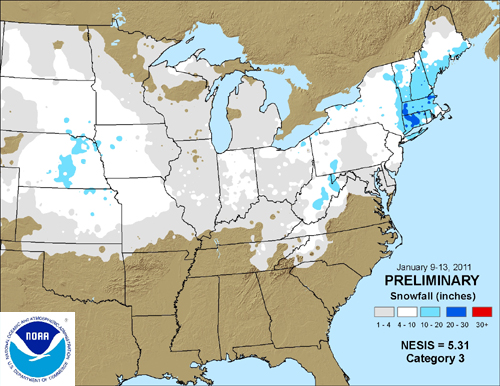
Snowfall Totals from January 11-12, 2011
Table of Contents
Storm Summary
Regional Surface Observations
National Weather Service Forecasts
Surface Maps
Satellite Imagery
National Surface Weather Maps - Pressure and Fronts Only
Continental Surface Weather Maps - Pressure and Fronts Only
Sea Level Pressure and 1000 to 500 Millibar Thickness Maps
850 Millibar Maps
700 Millibar Maps
500 Millibar Maps
300 Millibar Maps
200 Millibar Maps
National Radar Imagery
Regional Radar Imagery
Fort Dix Doppler Radar Imagery
Snow storm, December 26-27, 2010
Snow storm, January 7, 2011
Snow storm, January 8, 2011
Snow storm, January 11-12, 2011
Snow and ice storm, January 17-18, 2011
Snow storm, January 21, 2011
Snow and ice storm, January 26-27, 2011
Snow storm, February 21-22, 2011
Back to Ray's Winter Storm Archive
Copyright © 2011 by Raymond C Martin Jr. All rights reserved