

Storm description, surface observations, snowfall totals, and images courtesy of the National Climatic Data Center, the National Centers of Environmental Prediction, the Climate Prediction Center, the Hydrometeorological Prediction Center, the Mount Holly National Weather Service Office, the Upton National Weather Service Office, Rutgers University, Plymouth State University, the University of Illinois, the American Meteorological Society, Weather Graphics Technologies, AccuWeather, and the Weather Channel.
Table of Contents
Storm Summary
Regional Surface Observations
National Weather Service Forecasts
Surface Maps
Satellite Imagery
National Surface Weather Maps - Pressure and Fronts Only
Continental Surface Weather Maps - Pressure and Fronts Only
Sea Level Pressure and 1000 to 500 Millibar Thickness Maps
850 Millibar Maps
700 Millibar Maps
500 Millibar Maps
300 Millibar Maps
200 Millibar Maps
National Radar Imagery
Regional Radar Imagery
Fort Dix Doppler Radar Imagery
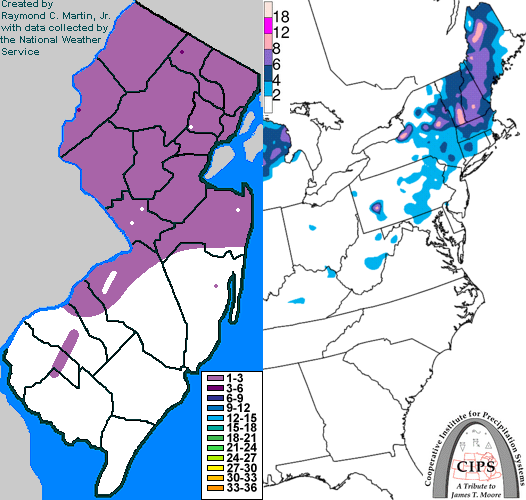
Contoured Snowfall Totals from January 17-18, 2011
STORM DESCRIPTION
A coastal storm brought a mixture of snow, ice and rain to New Jersey.
Synoptic Discussion
Low pressure began developing in the northeastern Gulf of Mexico during the early morning hours of January 17th. By the evening of the 17th the low was crossing the northern portion of the Florida peninsula. By the morning of the 18th the low had reached Cape Hatteras. It strengthened during the day and was just south of Rhode Island by the evening of the 18th. By the morning of the 19th the low was in Nova Scotia.
Local Discussion
Precipitation overspread most of New Jersey during the mid to late evening hours on the 17th, though it did not reach far northern New Jersey until after midnight on the 18th. It started as snow everywhere except extreme southern New Jersey, where it started as freezing rain and sleet before quickly changing to rain. The transition from snow to sleet and freezing rain spread north quickly, overspreading southern New Jersey by 2 AM EST, central New Jersey by 4 AM EST and northern New Jersey by 6 AM EST. Warmer air took longer to move north at the surface, with the sleet and freezing rain changing to rain across southern New Jersey by 8 AM EST, central New Jersey by 11 AM EST and northeastern New Jersey by 12 PM EST. A change to plain rain didn't occur in northwestern New Jersey before the precipitation ended statewide during the afternoon. Snow accumulations were highest in northern New Jersey where totals ranged from 1 to 3 inches, while accumulations in southern New Jersey were generally 1 inch or less. Ice accumulations ranged from a half inch in northern New Jersey to less than a tenth of an inch in parts of southern New Jersey. Minor tidal flooding also occurred along the coast.
New Jersey Snowfall Totals
Individual Snowfall Totals from January 17-18, 2011
Table of Contents
Storm Summary
Regional Surface Observations
National Weather Service Forecasts
Surface Maps
Satellite Imagery
National Surface Weather Maps - Pressure and Fronts Only
Continental Surface Weather Maps - Pressure and Fronts Only
Sea Level Pressure and 1000 to 500 Millibar Thickness Maps
850 Millibar Maps
700 Millibar Maps
500 Millibar Maps
300 Millibar Maps
200 Millibar Maps
National Radar Imagery
Regional Radar Imagery
Fort Dix Doppler Radar Imagery
Snow storm, December 26-27, 2010
Snow storm, January 7, 2011
Snow storm, January 8, 2011
Snow storm, January 11-12, 2011
Snow and ice storm, January 17-18, 2011
Snow storm, January 21, 2011
Snow and ice storm, January 26-27, 2011
Snow storm, February 21-22, 2011
Back to Ray's Winter Storm Archive
Copyright © 2011 by Raymond C Martin Jr. All rights reserved