

Storm description, surface observations, snowfall totals, and images courtesy of the National Climatic Data Center, the National Centers of Environmental Prediction, the Climate Prediction Center, the Hydrometeorological Prediction Center, the Mount Holly National Weather Service Office, the Upton National Weather Service Office, Rutgers University, Plymouth State University, the University of Illinois, the American Meteorological Society, Weather Graphics Technologies, AccuWeather, and the Weather Channel.
Table of Contents
Storm Summary
Regional Surface Observations
National Weather Service Forecasts
Surface Maps
Satellite Imagery
Sea Level Pressure and 1000 to 500 Millibar Thickness Maps
850 Millibar Maps
700 Millibar Maps
500 Millibar Maps
300 Millibar Maps
200 Millibar Maps
National Radar Imagery
Local Radar Imagery
Fort Dix Doppler Radar Imagery
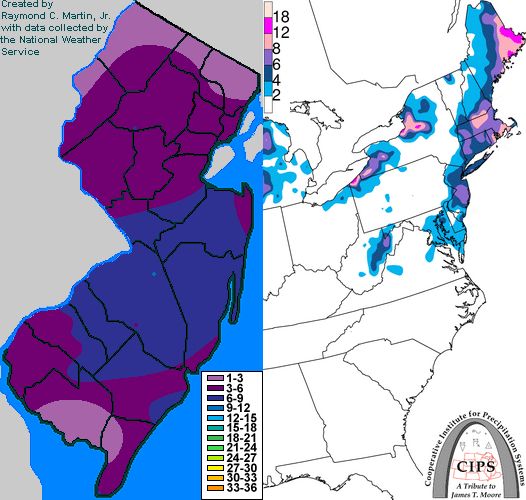
Contoured Snowfall Totals from March 2, 1996
STORM DESCRIPTION
Another coastal storm brought heavy snow to New Jersey. This storm continued the pattern begun by the previous storm in breaking local winter snowfall records.
Synoptic Discussion
A low pressure center developed in the South Carolina coastal waters on the morning of the 1st. It moved north during the next two days and was 200 miles off the coast of Cape Hattaras at dawn on the 2nd and about 150 miles east of Atlantic City during the afternoon. Its track was far enough off-shore to place the axis of heavy snow across New Jersey, with very little falling further west.
Local Discussion
Snow started between midnight and 6 am EST on the 2nd and fell at a heavy clip almost from the start. The heavy snow was over by noon. Accumulations of 6 to 8 inches were common in the southern half of the state from Burlington and Ocean counties south. Around 6 inches of snow fell in Mercer, Middlesex, and Monmouth counties, while 4 to 5 inches fell in Bergen, Passaic, Essex, Hudson, Union, Morris, Hunterdon, and Somerset counties. Only 2 to 4 inches fell in Sussex and Warren counties.
New Jersey Snowfall Totals
Individual Snowfall Totals from March 2, 1996
Regional Snowfall Totals
Snow Totals from 2300Z 2 March 1996 (6PM EST 2 March 1996)
Table of Contents
Storm Summary
Regional Surface Observations
National Weather Service Forecasts
Surface Maps
Satellite Imagery
Sea Level Pressure and 1000 to 500 Millibar Thickness Maps
850 Millibar Maps
700 Millibar Maps
500 Millibar Maps
300 Millibar Maps
200 Millibar Maps
National Radar Imagery
Local Radar Imagery
Fort Dix Doppler Radar Imagery
Snow storm, November 28-29, 1995
Snow storm, December 9, 1995
Snow and ice storm, December 14, 1995
Snow storm, December 16, 1995
Snow and ice storm, December 18-20, 1995
Ice storm, January 2-3, 1996
Blizzard, January 7-8, 1996
Snow and ice storm, January 12, 1996
Snow storm, February 2-3, 1996
Snow storm, February 16-17, 1996
Snow storm, March 2, 1996
Snow and ice storm, March 7-8, 1996
Snow storm, April 9-10, 1996
Back to Ray's Winter Storm Archive
Copyright © 2012 by Raymond C Martin Jr. All rights reserved