

Storm description, surface observations, snowfall totals, and images courtesy of the National Climatic Data Center, the National Centers of Environmental Prediction, the Climate Prediction Center, the Hydrometeorological Prediction Center, the Mount Holly National Weather Service Office, the Upton National Weather Service Office, Rutgers University, Plymouth State University, the University of Illinois, the American Meteorological Society, Weather Graphics Technologies, AccuWeather, and the Weather Channel.
Table of Contents
Storm Summary
Regional Surface Observations
National Weather Service Forecasts
Surface Maps
Satellite Imagery
Sea Level Pressure and 1000 to 500 Millibar Thickness Maps
850 Millibar Maps
700 Millibar Maps
500 Millibar Maps
300 Millibar Maps
200 Millibar Maps
National Radar Imagery
Local Radar Imagery
Fort Dix Doppler Radar Imagery
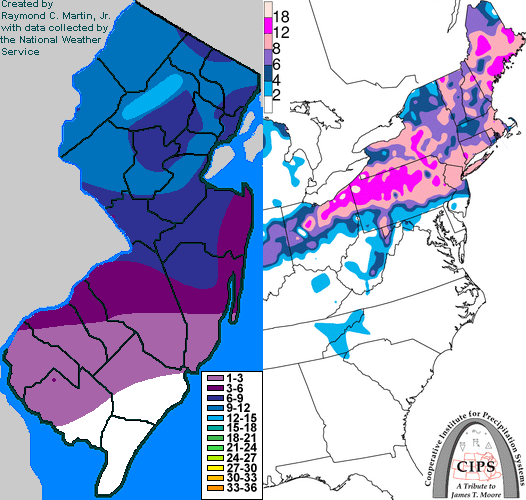
Contoured Snowfall Totals from December 18-20, 1995
STORM DESCRIPTION
A coastal storm brought a prolonged period of freezing rain to interior southeastern New Jersey, a mixture of snow, sleet, and freezing rain to southwestern and central New Jersey, heavy snow to northern New Jersey, minor tidal flooding to the ocean side of coastal New Jersey and minor to moderate tidal flooding to the back bays of coastal New Jersey.
Synoptic Discussion
Low pressure moved from the Big Bend of Texas the night of the 17th to Houston the morning of the 18th and into Kentucky the morning of the 19th. A secondary low developed on the North Carolina coast on the 19th, moved slowly northeast and intensified, and was located 500 miles east of Atlantic City on the morning of the 20th.
Local Discussion
Scattered light rain and flurries began across southern and central New Jersey during the evening of the 18th. In southwestern New Jersey, it became heavier as a mix of freezing rain, sleet, and snow after midnight. In southeastern New Jersey it remained warm enough for rain, and in central New Jersey it fell as snow. Precipitation intensity increased as it spread northwards early on the 19th to encompass the entire state. Surface winds remained strong out of the north to northeast, causing surface temperatures to gradually drop through the 20's across the state during the day, while mid-level winds were southernly and continued to gradually warm the air 5,000 to 10,000 feet above the surface. This resulted in a spreading potpourri of weather across the state during the day on the 19th. Northwestern sections remained all snow during the day. Northeastern New Jersey generally remained all snow, though some minor mixing with sleet occured with the most intense precipitation in the evening. Central New Jersey started the day as all snow which then changed to sleet around noon. Southwestern New Jersey started as freezing rain which mixed with or changed to sleet during the day. Southeastern sections began as rain which became freezing rain and occasional sleet as temperatures fell, except for coastal areas where the marine influence created a random mix of rain, freezing rain, and occasional sleet. During the night of the 19th, precipitation became all snow across the state as the low pressure passed by to the southeast and mid-level winds changed direction, with the heaviest snow falling during the first half ot the night. However, light to moderate snow persisted with a lingering upper-level disturbance until the afternoon of the 20th. Accumulations were very dependent on how long precipitation fell as snow with a northwest-to-southeast gradient across the state. Northern New Jersey averaged 9 to 12 inches, central sections 6 to 10 inches including up to an inch of sleet, southwestern sections 2 to 4 inches with 1 to 2 inches that being sleet, and about 1 inch of snow in southeastern sections with 1/2 inch to 3/4 inch of ice accrual. Additionally, the strong on-shore flow combined with spring tides to cause minor tidal flooding along the ocean front and moderate flooding in the back bays. Ocean tides reached 7.0 to 7.5 feet above mean low water.
New Jersey Snowfall Totals
Individual Snowfall Totals from December 18-20, 1995
Regional Snowfall Totals
Snow Totals from 0000Z 21 December 1995 (7PM EST 20 December 1995)
Table of Contents
Storm Summary
Regional Surface Observations
National Weather Service Forecasts
Surface Maps
Satellite Imagery
Sea Level Pressure and 1000 to 500 Millibar Thickness Maps
850 Millibar Maps
700 Millibar Maps
500 Millibar Maps
300 Millibar Maps
200 Millibar Maps
National Radar Imagery
Local Radar Imagery
Fort Dix Doppler Radar Imagery
Snow storm, November 28-29, 1995
Snow storm, December 9, 1995
Snow and ice storm, December 14, 1995
Snow storm, December 16, 1995
Snow and ice storm, December 18-20, 1995
Ice storm, January 2-3, 1996
Blizzard, January 7-8, 1996
Snow and ice storm, January 12, 1996
Snow storm, February 2-3, 1996
Snow storm, February 16-17, 1996
Snow storm, March 2, 1996
Snow and ice storm, March 7-8, 1996
Snow storm, April 9-10, 1996
Back to Ray's Winter Storm Archive
Copyright © 2012 by Raymond C Martin Jr. All rights reserved