

Storm description, surface observations, snowfall totals, and images courtesy of the National Climatic Data Center, the National Centers of Environmental Prediction, the Climate Prediction Center, the Hydrometeorological Prediction Center, the Mount Holly National Weather Service Office, the Upton National Weather Service Office, Rutgers University, Plymouth State University, the University of Illinois, the American Meteorological Society, Weather Graphics Technologies, AccuWeather, and the Weather Channel.
Table of Contents
Storm Summary
Regional Surface Observations
National Weather Service Forecasts
Surface Maps
Satellite Imagery
Sea Level Pressure and 1000 to 500 Millibar Thickness Maps
850 Millibar Maps
700 Millibar Maps
500 Millibar Maps
300 Millibar Maps
200 Millibar Maps
National Radar Imagery
Local Radar Imagery
Fort Dix Doppler Radar Imagery
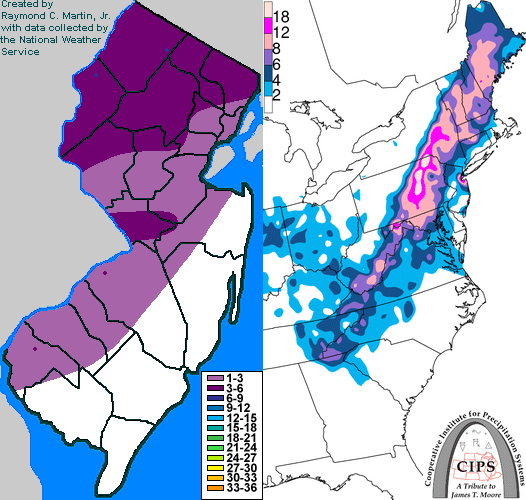
Contoured Snowfall Totals from January 12, 1996
STORM DESCRIPTION
For the second time in a week, heavy snow moved across New Jersey. Fortunately, this storm was much weaker than its predecessor.
Synoptic Discussion
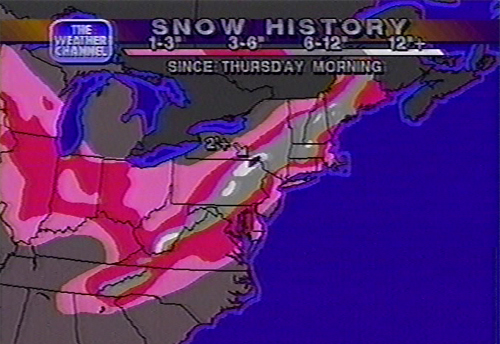
The storm center moved eastward from the lower Tennessee Valley on the evening of the 11th to eastern North Carolina on the morning of the 12th, then northward to just off the New Jersey coast the evening of the 12th and into New England on the 13th.
Local Discussion
Precipitation fell for about a 12-hour period during the day. It started as moderate to heavy snow across the state between 7 and 9 AM EST but changed to sleet, freezing rain and then rain across most of the state during the late morning and afternoon hours. While the change to ice and rain limited snow accumulations, the heavy rain caused local and urban flooding due to melting snow and clogged drains and streams. Accumulations averaged 4 to 6 inches in Sussex and Warren counties, 3 to 5 inches in Hunterdon, Morris, Somerset, Passaic, and Mercer counties, and 1 to 3 inches across the rest of the state except the far southeast, which saw less than 1 inch.
New Jersey Snowfall Totals
Individual Snowfall Totals from January 12, 1996
Regional Snowfall Totals
Snow Totals from 0900Z 13 January 1996 (4AM EST 13 January 1996)
Table of Contents
Storm Summary
Regional Surface Observations
National Weather Service Forecasts
Surface Maps
Satellite Imagery
Sea Level Pressure and 1000 to 500 Millibar Thickness Maps
850 Millibar Maps
700 Millibar Maps
500 Millibar Maps
300 Millibar Maps
200 Millibar Maps
National Radar Imagery
Local Radar Imagery
Fort Dix Doppler Radar Imagery
Snow storm, November 28-29, 1995
Snow storm, December 9, 1995
Snow and ice storm, December 14, 1995
Snow storm, December 16, 1995
Snow and ice storm, December 18-20, 1995
Ice storm, January 2-3, 1996
Blizzard, January 7-8, 1996
Snow and ice storm, January 12, 1996
Snow storm, February 2-3, 1996
Snow storm, February 16-17, 1996
Snow storm, March 2, 1996
Snow and ice storm, March 7-8, 1996
Snow storm, April 9-10, 1996
Back to Ray's Winter Storm Archive
Copyright © 2012 by Raymond C Martin Jr. All rights reserved