

Storm description, surface observations, snowfall totals, and images courtesy of the National Climatic Data Center, the National Centers of Environmental Prediction, the Climate Prediction Center, the Hydrometeorological Prediction Center, the Mount Holly National Weather Service Office, the Upton National Weather Service Office, Rutgers University, Plymouth State University, the University of Illinois, the American Meteorological Society, Weather Graphics Technologies, AccuWeather, and the Weather Channel.
Table of Contents
Storm Summary
Regional Surface Observations
National Weather Service Forecasts
Surface Maps
Satellite Imagery
Sea Level Pressure and 1000 to 500 Millibar Thickness Maps
850 Millibar Maps
700 Millibar Maps
500 Millibar Maps
300 Millibar Maps
200 Millibar Maps
National Radar Imagery
Local Radar Imagery
Fort Dix Doppler Radar Imagery
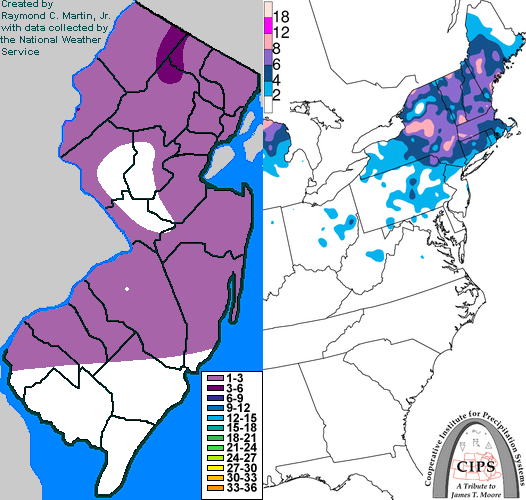
Contoured Snowfall Totals from December 14, 1995
STORM DESCRIPTION
A low pressure moving through the Great Lakes and its associated warm front brought a wintry mix of snow, sleet, and freezing rain to most of New Jersey.
Synoptic Discussion
Low pressure crossed the northern Great Plains on the 13th, reaching the Great Lakes in the evening. By the evening of the 14th, the low had moved into southeastern Canada.
Local Discussion
Precipitation started as snow across the area a little after midnight on the 14th. As warmer air moved in aloft, the snow changed to sleet and freezing rain between 4 and 7 AM EST across the southern half of the state and during the morning hours in the northern half of the state. Precipitation changed to rain along the coast and ended before noon in southern New Jersey and by sunset in northern New Jersey. Snowfall amounts averaged 1 to 3 inches across the southern half of the state and around 3 inches in the northern half of the state.
New Jersey Snowfall Totals
Individual Snowfall Totals from December 14, 1995
Table of Contents
Storm Summary
Regional Surface Observations
National Weather Service Forecasts
Surface Maps
Satellite Imagery
Sea Level Pressure and 1000 to 500 Millibar Thickness Maps
850 Millibar Maps
700 Millibar Maps
500 Millibar Maps
300 Millibar Maps
200 Millibar Maps
National Radar Imagery
Local Radar Imagery
Fort Dix Doppler Radar Imagery
Snow storm, November 28-29, 1995
Snow storm, December 9, 1995
Snow and ice storm, December 14, 1995
Snow storm, December 16, 1995
Snow and ice storm, December 18-20, 1995
Ice storm, January 2-3, 1996
Blizzard, January 7-8, 1996
Snow and ice storm, January 12, 1996
Snow storm, February 2-3, 1996
Snow storm, February 16-17, 1996
Snow storm, March 2, 1996
Snow and ice storm, March 7-8, 1996
Snow storm, April 9-10, 1996
Back to Ray's Winter Storm Archive
Copyright © 2012 by Raymond C Martin Jr. All rights reserved