

Storm description, surface observations, snowfall totals, and images courtesy of the National Climatic Data Center, the National Centers of Environmental Prediction, the Climate Prediction Center, the Hydrometeorological Prediction Center, the Mount Holly National Weather Service Office, the Upton National Weather Service Office, Rutgers University, Plymouth State University, the University of Illinois, the American Meteorological Society, Weather Graphics Technologies, AccuWeather, and the Weather Channel.
Table of Contents
Storm Summary
Regional Surface Observations
National Weather Service Forecasts
Surface Maps
Satellite Imagery
Sea Level Pressure and 1000 to 500 Millibar Thickness Maps
850 Millibar Maps
700 Millibar Maps
500 Millibar Maps
300 Millibar Maps
200 Millibar Maps
National Radar Imagery
Local Radar Imagery
Fort Dix Doppler Radar Imagery
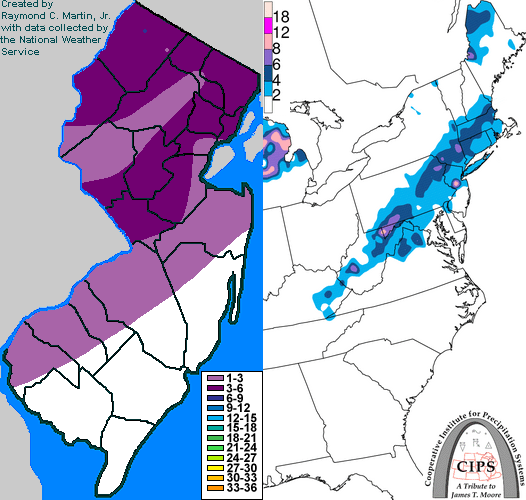
Contoured Snowfall Totals from November 28-29, 1995
STORM DESCRIPTION
The first snow of the 1995-1996 season in New Jersey arrived with a frontal wave in late November.
Synoptic Discussion
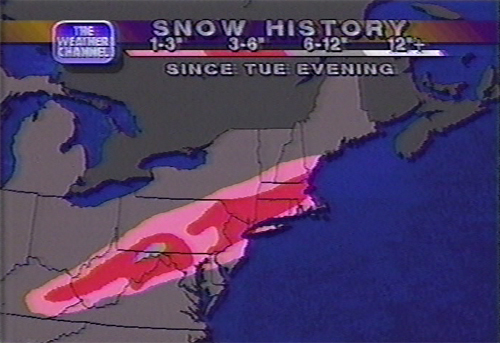
Late on the 28th and on the 29th, series of weak low pressures moved northeast through North Carolina and Viriginia along a cold front which had passed through the Mid-Atlantic earlier on the 28th. The last low moved off the Viriginia coast and out to sea late on the 29th.
Local Discussion
Snow began falling in northwest New Jersey early in the morning on the 29th. Around 3 inches accumulated in Warren and Morris counties with 4 to 5 inches in Sussex County. Further south, precipitation started as rain during the evening of the 28th but turned to sleet and snow during the early morning hours of the 29th. Accumulations were lighter, mainly 2 to 3 inches. Little if any snow fell in Atlantic, Cumberland, and Cape May counties. Precipitation ended by mid-morning on the 29th.
New Jersey Snowfall Totals
Individual Snowfall Totals from November 28-29, 1995
Regional Snowfall Totals
Snowfall Totals from 0000Z 30 November 1995 (7PM EST 29 November 1995)
Table of Contents
Storm Summary
Regional Surface Observations
National Weather Service Forecasts
Surface Maps
Satellite Imagery
Sea Level Pressure and 1000 to 500 Millibar Thickness Maps
850 Millibar Maps
700 Millibar Maps
500 Millibar Maps
300 Millibar Maps
200 Millibar Maps
National Radar Imagery
Local Radar Imagery
Fort Dix Doppler Radar Imagery
Snow storm, November 28-29, 1995
Snow storm, December 9, 1995
Snow and ice storm, December 14, 1995
Snow storm, December 16, 1995
Snow and ice storm, December 18-20, 1995
Ice storm, January 2-3, 1996
Blizzard, January 7-8, 1996
Snow and ice storm, January 12, 1996
Snow storm, February 2-3, 1996
Snow storm, February 16-17, 1996
Snow storm, March 2, 1996
Snow and ice storm, March 7-8, 1996
Snow storm, April 9-10, 1996
Back to Ray's Winter Storm Archive
Copyright © 2012 by Raymond C Martin Jr. All rights reserved