

Storm description, surface observations, snowfall totals, and images courtesy of the National Climatic Data Center, the National Centers of Environmental Prediction, the Climate Prediction Center, the Hydrometeorological Prediction Center, the Mount Holly National Weather Service Office, the Upton National Weather Service Office, Rutgers University, Plymouth State University, the University of Illinois, the American Meteorological Society, Weather Graphics Technologies, AccuWeather, and the Weather Channel.
Table of Contents
Storm Summary
Regional Surface Observations
National Weather Service Forecasts
Surface Maps
Satellite Imagery
Sea Level Pressure and 1000 to 500 Millibar Thickness Maps
850 Millibar Maps
700 Millibar Maps
500 Millibar Maps
300 Millibar Maps
200 Millibar Maps
National Radar Imagery
Local Radar Imagery
Fort Dix Doppler Radar Imagery
Storm Photos
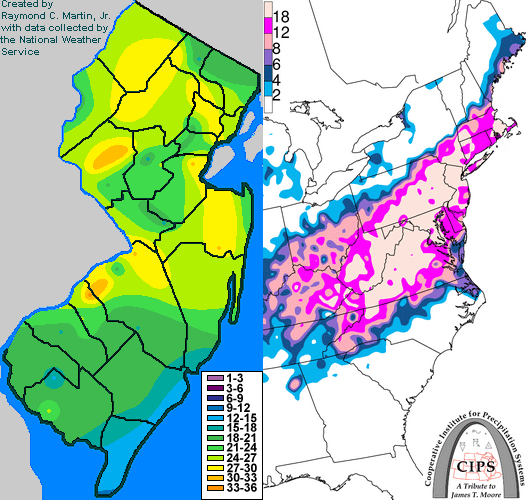
Contoured Snowfall Totals from January 7-8, 1996
STORM DESCRIPTION
The "Blizzard of '96", which was also the second-coined "Storm of the Century" of the 1990's, brought record-breaking snow to most of New Jersey and produced moderate coastal flooding with moderate to severe beach erosion along the New Jersey shore from Manasquan southwards.
Synoptic Discussion
The storm formed in the Gulf of Mexico the morning of the 6th, moved south of Alabama the evening of the 6th, reached Savannah, Georgia the morning of the 7th, Cape Hattaras the evening of the 7th, just east of the Delaware Bay the morning of the 8th, and the southern New England coastal waters the evening of the 8th. This was a classic storm track for heavy snow.
Local Discussion
Snow began falling during the predawn hours of the 7th and became heavy at times during the morning. Blizzard conditions developed during the afternoon and evening as strong northeast winds developed around the intensifying low pressure. During the afternoon hours, precipitation in far southern New Jersey changed to sleet and freezing rain as the low brought in warm air at mid-levels, but remained all snow across the rest of the state. During the evening and overnight hours the snow mixed with sleet as far north as central sections of the state as the low center approached the state from the south. A lull developed in the precipitation in the pre-dawn hours of the 8th as the low center was just off the New Jersey coast, but wraparound moisture brought another period of snow to the state as the low pulled away during the later morning and early afternoon hours of the 8th. Accumulations averaged 24 to 27 inches in Sussex County, 20 to 27 inches in Warren County, 23 to 28 inches in Morris County, generally 20 to 30 inches in Bergen, Passaic, Union, Hudson, Essex, Hunterdon, Somerset, Mercer, and Monmouth counties, 19 to 32 inches in Middlesex County, 18 to 31 inches in Burlington County, 16 to 24 inches in Salem, Gloucester, and Camden counties, 24 inches inland and 10 to 14 inches at the coast in Ocean County, and 10 to 18 inches in Cumberland, Atlantic, and Cape May counties. In addition to the heavy snow, wind gusts reached hurricane force along the coast during the evening of the 7th, with an 81 mph gust recorded in Ocean Grove. While accumulations were lighter along the shore, the strong northeasterly flow produced moderate coastal flooding at the time of high tide on the evening of the 7th, with tides 3 to 4 feet above normal. The tide reached 7.5 feet above mean low water in Atlantic Coutny and 8.5 feet above mean low water in Cape May County. Fortunately, winds switched to the northwest before worse flooding could occur at high tide on the morning of the 8th.
New Jersey Snowfall Totals

Individual Snowfall Totals from January 7-8, 1996
Regional Snowfall Totals
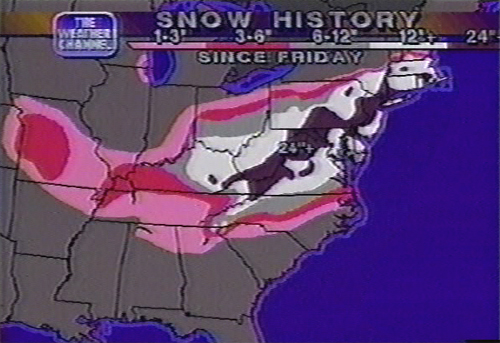
Snow Totals from 0600Z 9 January 1996 (1AM EST 9 January 1996)
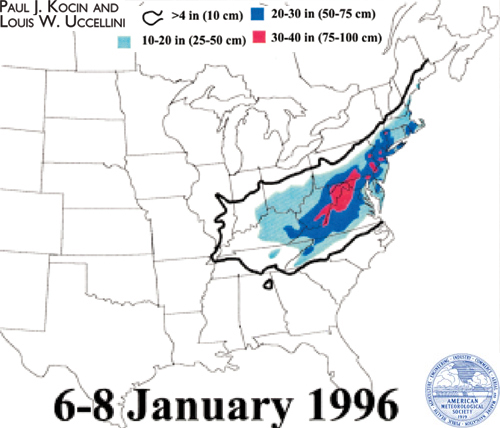
Final Snowfall Totals from January 6-8, 1996
Table of Contents
Storm Summary
Regional Surface Observations
National Weather Service Forecasts
Surface Maps
Satellite Imagery
Sea Level Pressure and 1000 to 500 Millibar Thickness Maps
850 Millibar Maps
700 Millibar Maps
500 Millibar Maps
300 Millibar Maps
200 Millibar Maps
National Radar Imagery
Local Radar Imagery
Fort Dix Doppler Radar Imagery
Storm Photos
Snow storm, November 28-29, 1995
Snow storm, December 9, 1995
Snow and ice storm, December 14, 1995
Snow storm, December 16, 1995
Snow and ice storm, December 18-20, 1995
Ice storm, January 2-3, 1996
Blizzard, January 7-8, 1996
Snow and ice storm, January 12, 1996
Snow storm, February 2-3, 1996
Snow storm, February 16-17, 1996
Snow storm, March 2, 1996
Snow and ice storm, March 7-8, 1996
Snow storm, April 9-10, 1996
Back to Ray's Winter Storm Archive
Copyright © 2012 by Raymond C Martin Jr. All rights reserved