

Storm description, surface observations, snowfall totals, and images courtesy of the National Climatic Data Center, the National Centers of Environmental Prediction, the Climate Prediction Center, the Hydrometeorological Prediction Center, the Mount Holly National Weather Service Office, the Upton National Weather Service Office, Rutgers University, Plymouth State University, the University of Illinois, the American Meteorological Society, Weather Graphics Technologies, AccuWeather, and the Weather Channel.
Table of Contents
Storm Summary
Regional Surface Observations
National Weather Service Forecasts
Surface Maps
Satellite Imagery
Sea Level Pressure and 1000 to 500 Millibar Thickness Maps
850 Millibar Maps
700 Millibar Maps
500 Millibar Maps
300 Millibar Maps
200 Millibar Maps
National Radar Imagery
Local Radar Imagery
Fort Dix Doppler Radar Imagery
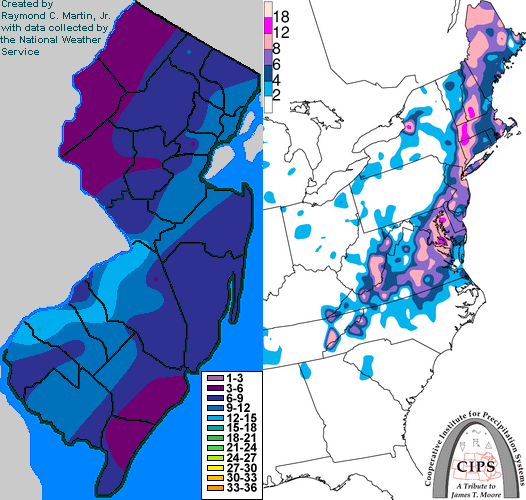
Contoured Snowfall Totals from February 16-17, 1996
STORM DESCRIPTION
Another strong coastal low brought another swath of heavy snow to New Jersey. This storm was the first to begin breaking seasonal snowfall records, which continued with later storms until all seasonal snowfall records in the northeast megalopolis had been broken.
Synoptic Discussion
A low pressure lingered over North Carolina on the 15th and developed quickly once it reached Cape Hattaras on the morning of the 16th. It then moved northeast over the western Atlantic and reached the Gulf of Maine by the morning of the 17th. This track was far enough off shore that cold air remained along the coast and the axis of heavy snow was over New Jersey.
Local Discussion
Snow began during the morning of the 16th. The snow became very heavy during the afternoon and evening hours before ending early on the 17th. Accumulations averaged 6 to 8 inches, but there was a swath of 1 foot snows along the New Jersey Turnpike from Gloucester County northeast through Bergen County. The least snow fell in the extreme northwest, where only 3 to 5 inches fell in Sussex and Warren counties.
New Jersey Snowfall Totals
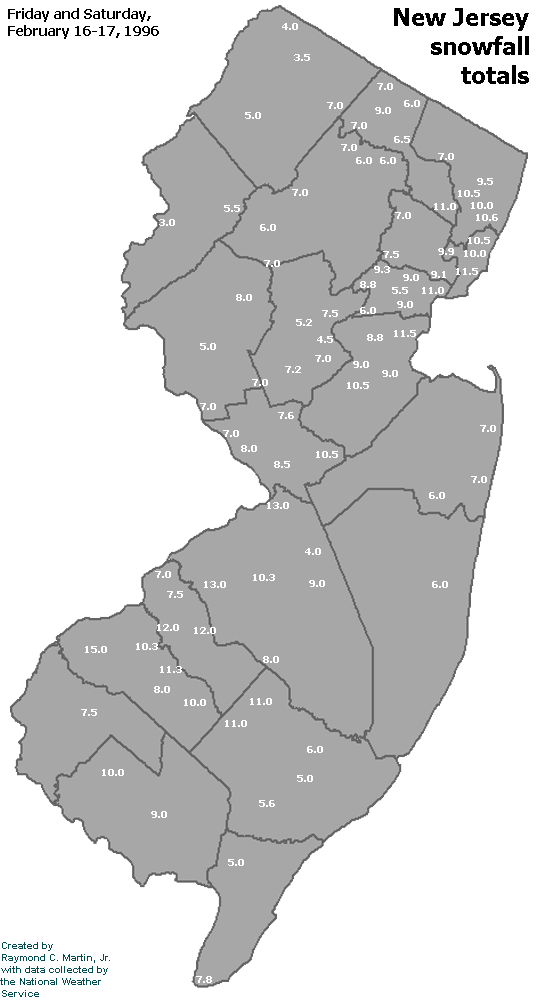
Individual Snowfall Totals from February 16-17, 1996
Regional Snowfall Totals
Snow Totals from 1700Z 17 February 1996 (12PM EST 17 February 1996)
Table of Contents
Storm Summary
Regional Surface Observations
National Weather Service Forecasts
Surface Maps
Satellite Imagery
Sea Level Pressure and 1000 to 500 Millibar Thickness Maps
850 Millibar Maps
700 Millibar Maps
500 Millibar Maps
300 Millibar Maps
200 Millibar Maps
National Radar Imagery
Local Radar Imagery
Fort Dix Doppler Radar Imagery
Snow storm, November 28-29, 1995
Snow storm, December 9, 1995
Snow and ice storm, December 14, 1995
Snow storm, December 16, 1995
Snow and ice storm, December 18-20, 1995
Ice storm, January 2-3, 1996
Blizzard, January 7-8, 1996
Snow and ice storm, January 12, 1996
Snow storm, February 2-3, 1996
Snow storm, February 16-17, 1996
Snow storm, March 2, 1996
Snow and ice storm, March 7-8, 1996
Snow storm, April 9-10, 1996
Back to Ray's Winter Storm Archive
Copyright © 2012 by Raymond C Martin Jr. All rights reserved