

Storm description, surface observations, snowfall totals, and images courtesy of the National Climatic Data Center, the National Centers of Environmental Prediction, the Climate Prediction Center, the Hydrometeorological Prediction Center, the Mount Holly National Weather Service Office, the Upton National Weather Service Office, Rutgers University, Plymouth State University, the University of Illinois, the American Meteorological Society, Weather Graphics Technologies, AccuWeather, and the Weather Channel.
Table of Contents
Storm Summary
Regional Surface Observations
National Weather Service Forecasts
Surface Maps
Satellite Imagery
National Surface Weather Maps - Pressure and Fronts Only
Continental Surface Weather Maps - Pressure and Fronts Only
Sea Level Pressure and 1000 to 500 Millibar Thickness Maps
850 Millibar Maps
700 Millibar Maps
500 Millibar Maps
300 Millibar Maps
200 Millibar Maps
National Radar Imagery
Regional Radar Imagery
Local Radar Imagery
Fort Dix Doppler Radar Imagery
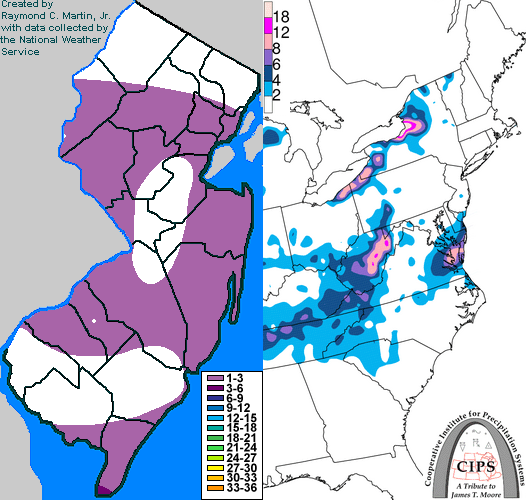
Contoured Snowfall Totals from January 16-17, 2003
STORM DESCRIPTION
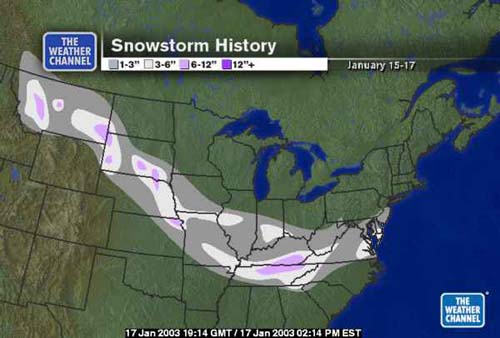
A storm system from the central Rockies spread snow across New Jersey on the night of the 16th. However, most significant snow remained south of the state.
Synoptic Discussion
The low pressure system developed in the central Rockies on the morning of the 15th. By the morning of the 16th, it was already over the Ozark Mountains, and by the morning of the 17th, was 250 miles east of the Delmarva Peninsula. Its rapid movement and southerly track kept the heavy snow away from most of the state.
Local Discussion
Snow overspread the state during the evening of the 16th. The heaviest snow was confined to Cape May County, while all areas further north only saw a few hours of light snow. The snow tapered off during the early morning hours of the 17th. Accumulations ranged from 2 to 4 inches across Cape May County, and only a coating to 2 inches across the rest of New Jersey.
New Jersey Snowfall Totals
Individual Snowfall Totals from January 16-17, 2003
Regional Snowfall Totals
Snow Totals from 1900Z 17 January 2003 (2PM EST 17 January 2003)
Table of Contents
Storm Summary
Regional Surface Observations
National Weather Service Forecasts
Surface Maps
Satellite Imagery
National Surface Weather Maps - Pressure and Fronts Only
Continental Surface Weather Maps - Pressure and Fronts Only
Sea Level Pressure and 1000 to 500 Millibar Thickness Maps
850 Millibar Maps
700 Millibar Maps
500 Millibar Maps
300 Millibar Maps
200 Millibar Maps
National Radar Imagery
Regional Radar Imagery
Local Radar Imagery
Fort Dix Doppler Radar Imagery
Snow storm, December 5, 2002
Snow and ice storm, December 24-26, 2002
Snow storm, January 5, 2003
Snow storm, January 16-17, 2003
Snow storm, January 29, 2003
Snow storm, February 6-7, 2003
Snow storm, February 16-17, 2003
Snow storm, February 27-28, 2003
Snow and ice storm, March 6, 2003
Snow and ice storm, April 7, 2003
Back to Ray's Winter Storm Archive
Copyright © 2012 by Raymond C Martin Jr. All rights reserved