

Storm description, surface observations, snowfall totals, and images courtesy of the National Climatic Data Center, the National Centers of Environmental Prediction, the Climate Prediction Center, the Hydrometeorological Prediction Center, the Mount Holly National Weather Service Office, the Upton National Weather Service Office, Rutgers University, Plymouth State University, the University of Illinois, the American Meteorological Society, Weather Graphics Technologies, AccuWeather, and the Weather Channel.
Table of Contents
Storm Summary
Regional Surface Observations
National Weather Service Forecasts
Surface Maps
Satellite Imagery
National Surface Weather Maps - Pressure and Fronts Only
Continental Surface Weather Maps - Pressure and Fronts Only
Sea Level Pressure and 1000 to 500 Millibar Thickness Maps
850 Millibar Maps
700 Millibar Maps
500 Millibar Maps
300 Millibar Maps
200 Millibar Maps
National Radar Imagery
Regional Radar Imagery
Local Radar Imagery
Fort Dix Doppler Radar Imagery
Storm Photos
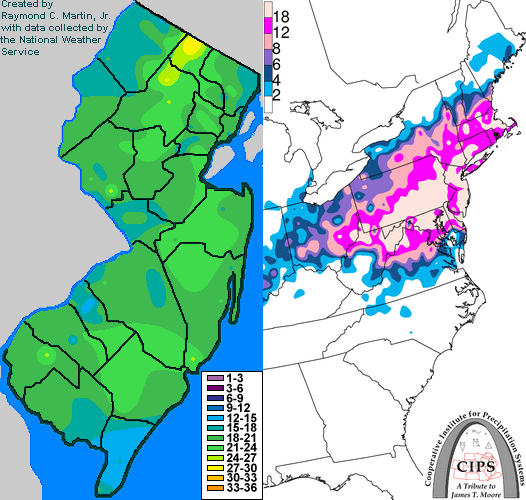
Contoured Snowfall Totals from February 16-17, 2003
STORM DESCRIPTION
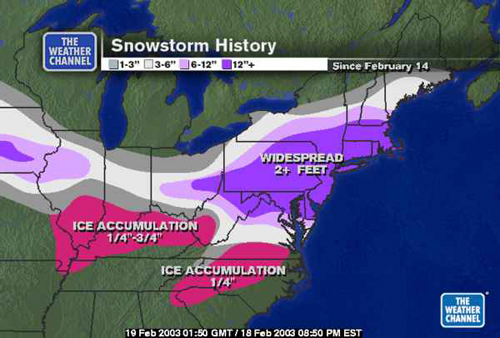
The "Presidents Day Storm of 2003", also known as the "Presidents Day Storm II" and the "Blizzard of 2003", was a moisture-laden winter storm which dropped 1 to 2 feet of snow across the entire state of New Jersey. It was the heaviest state-wide snowstorm since the Blizzard of '96.
Synoptic Discussion
The low pressure system which helped cause the snow developed in the lee of the southern Rockies on February 14th. It moved to southern Missouri by the morning of the 15th, the lower Tennessee Valley by the morning of the 16th, reformed off the Virginia coast by the morning of the 17th, and moved southeast of Cape Cod by the morning of the 18th. At the same time, a very strong high pressure system settled into place over southeastern Canada, locking very cold air in across the entire Northeast. It also slowed the low pressure system down and prevented it from moving any further north, allowing the state to remain on the cold and snowy side of the storm system.
Local Discussion
Snow spread northward very slowly during the day of the 16th, starting in Cape May and Cumberland counties near dawn and finally reaching Sussex County late in the evening. The heaviest snow fell during the day on the 16th across southern New Jersey, overnight on the 16th in central parts of the state, and during the day on the 17th in northern New Jersey. By later in the day on the 16th into the early morning of the 17th, warmer air between 5,000 and 10,000 feet above the ground streamed northward, causing snow to change to sleet from Mercer and Monmouth counties southward by the morning of th 17th. Immediate coastal areas in Cape May and Atlantic counties recieved enough warm air aloft and at the surface to cause precipitaton to change to freezing rain and rain for a time. As the storm began passing New Jersey, precipitation changed back to snow across southern sections of the state during the morning of the 17th before ending entirely during the afternoon. Snow continued into the evening of the 17th in northern parts of the state, and finally ended in all areas near midnight on the 18th. Snowfall totals were impressive across the state, but while some daily snowfall records were broken, no storm records were set (most records now being held by the Blizzard of 1996). Total accumulations were 20 to 28 inches across Passaic and Morris counties, 18 to 26 inches in Essex and Union counties, 14 to 24 inches in Hunterdon, Ocean and Burlington counties, 15 to 22 inches in Bergen, Sussex, Somerset, Middlesex, Mercer, and Monmouth counties, 13 to 22 inches in Gloucester and Camden counties, 12 to 20 inches in Warren, Hudson, Salem, Cumberland, and Atlantic counties, and 12 to 18 inches in Cape May County. Additionally, snow drifts reached 6 feet in Monmouth County and 7 feet in Ocean County. Besides the heavy snow, moderate tidal flooding and moderate to locally severe beach erosion affected coastal communities. The high tide on the morning of the 17th reached 8.69 feet above mean lower low water in Wildwood, 8.16 feet at Cape May, 8.06 feet at Stone Harbor, 7.98 feet at Sandy Hook, 7.50 feet at Margate, 7.45 feet at Atlantic City, and 7.13 feet at Absecon. Winds were fierce near the coast, reaching 57 mph at Cape May, 53 mph at Atlantic City, 49 mph at Keansburg and Wildwood, and 45 mph at Belmar. While winds were lighter inland, winds of 20 to 30 mph caused near-blizzard conditions.
New Jersey Snowfall Totals
Individual Snowfall Totals from February 16-17, 2003
Regional Snowfall Totals
Snow Totals from 0200Z 19 February 2003 (9PM EST 18 February 2003)
Table of Contents
Storm Summary
Regional Surface Observations
National Weather Service Forecasts
Surface Maps
Satellite Imagery
National Surface Weather Maps - Pressure and Fronts Only
Continental Surface Weather Maps - Pressure and Fronts Only
Sea Level Pressure and 1000 to 500 Millibar Thickness Maps
850 Millibar Maps
700 Millibar Maps
500 Millibar Maps
300 Millibar Maps
200 Millibar Maps
National Radar Imagery
Regional Radar Imagery
Local Radar Imagery
Fort Dix Doppler Radar Imagery
Storm Photos
Snow storm, December 5, 2002
Snow and ice storm, December 24-26, 2002
Snow storm, January 5, 2003
Snow storm, January 16-17, 2003
Snow storm, January 29, 2003
Snow storm, February 6-7, 2003
Snow storm, February 16-17, 2003
Snow storm, February 27-28, 2003
Snow and ice storm, March 6, 2003
Snow and ice storm, April 7, 2003
Back to Ray's Winter Storm Archive
Copyright © 2012 by Raymond C Martin Jr. All rights reserved