

Storm description, surface observations, snowfall totals, and images courtesy of the National Climatic Data Center, the National Centers of Environmental Prediction, the Climate Prediction Center, the Hydrometeorological Prediction Center, the Mount Holly National Weather Service Office, the Upton National Weather Service Office, Rutgers University, Plymouth State University, the University of Illinois, the American Meteorological Society, Weather Graphics Technologies, AccuWeather, and the Weather Channel.
Table of Contents
Storm Summary
Regional Surface Observations
National Weather Service Forecasts
Surface Maps
Satellite Imagery
National Surface Weather Maps - Pressure and Fronts Only
Continental Surface Weather Maps - Pressure and Fronts Only
Sea Level Pressure and 1000 to 500 Millibar Thickness Maps
850 Millibar Maps
700 Millibar Maps
500 Millibar Maps
300 Millibar Maps
200 Millibar Maps
National Radar Imagery
Regional Radar Imagery
Local Radar Imagery
Fort Dix Doppler Radar Imagery
Storm Photos
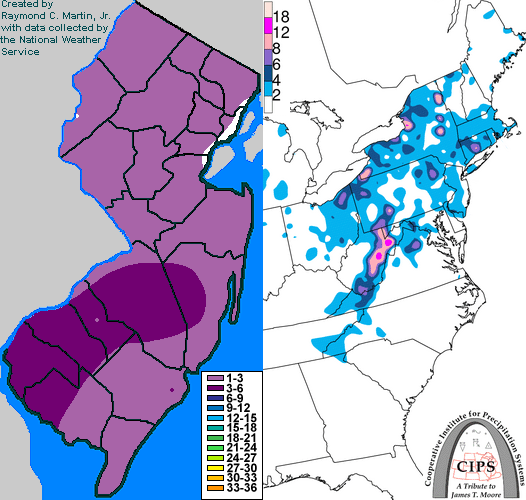
Contoured Snowfall Totals from January 5, 2003
STORM DESCRIPTION
A potent Alberta Clipper produced heavy snow across extreme southwestern New Jersey and an accumulating snow of 2 to 4 inches across the rest of the southern half of New Jersey. Accumulations farther north were less than 2 inches. The largest accumulations were in Salem and Gloucester counties.
Synoptic Discussion
The low pressure system in Saskatchewan Province on the 3rd, moved southeast to Minnesota on the morning of the 4th, southern Indiana on the morning of the 5th, and was well east of the Delmarva Peninsula on the morning of the 6th. Historically, Alberta type low pressure systems usually do not produce heavy snow. But the air at mid-levels of the atmosphere was quite cold and this enhanced the instability with this low pressure system. While no thunderstorms occured, the instability did produce heavier precipitation.
Local Discussion
Snow began falling during the early afternoon and was heaviest during the late afternoon. It ended during the evening. Accumulations were 3 to 5 inches in Salem County, 2 to 4 inches in Gloucester and Camden counties, 2 to 3 inches in Burlington, Atlantic, Ocean and Cumberland counties, 1 to 2 inches in Mercer, Monmouth, and Cape May counties, and around 1 inch in Hunterdon, Somerset, Middlesex, Union, Essex, Hudson, Morris, Passaic, Bergen, Warren, and Sussex counties.
New Jersey Snowfall Totals
Individual Snowfall Totals from January 5, 2003
Table of Contents
Storm Summary
Regional Surface Observations
National Weather Service Forecasts
Surface Maps
Satellite Imagery
National Surface Weather Maps - Pressure and Fronts Only
Continental Surface Weather Maps - Pressure and Fronts Only
Sea Level Pressure and 1000 to 500 Millibar Thickness Maps
850 Millibar Maps
700 Millibar Maps
500 Millibar Maps
300 Millibar Maps
200 Millibar Maps
National Radar Imagery
Regional Radar Imagery
Local Radar Imagery
Fort Dix Doppler Radar Imagery
Storm Photos
Snow storm, December 5, 2002
Snow and ice storm, December 24-26, 2002
Snow storm, January 5, 2003
Snow storm, January 16-17, 2003
Snow storm, January 29, 2003
Snow storm, February 6-7, 2003
Snow storm, February 16-17, 2003
Snow storm, February 27-28, 2003
Snow and ice storm, March 6, 2003
Snow and ice storm, April 7, 2003
Back to Ray's Winter Storm Archive
Copyright © 2012 by Raymond C Martin Jr. All rights reserved