

Storm description, surface observations, snowfall totals, and images courtesy of the National Climatic Data Center, the National Centers of Environmental Prediction, the Climate Prediction Center, the Hydrometeorological Prediction Center, the Mount Holly National Weather Service Office, the Upton National Weather Service Office, Rutgers University, Plymouth State University, the University of Illinois, the American Meteorological Society, Weather Graphics Technologies, AccuWeather, and the Weather Channel.
Table of Contents
Storm Summary
Regional Surface Observations
National Weather Service Forecasts
Surface Maps
Satellite Imagery
National Surface Weather Maps - Pressure and Fronts Only
Continental Surface Weather Maps - Pressure and Fronts Only
Sea Level Pressure and 1000 to 500 Millibar Thickness Maps
850 Millibar Maps
700 Millibar Maps
500 Millibar Maps
300 Millibar Maps
200 Millibar Maps
National Radar Imagery
Regional Radar Imagery
Local Radar Imagery
Fort Dix Doppler Radar Imagery
Storm Photos
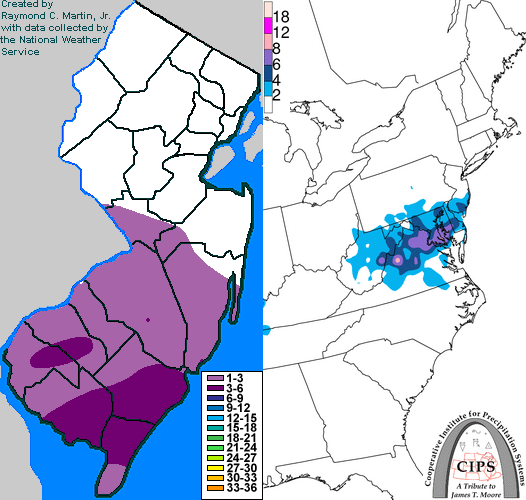
Contoured Snowfall Totals from February 27-28, 2003
STORM DESCRIPTION
Another low pressure system spread snow across the southern half of the state.
Synoptic Discussion
The low pressure system developed in the western Gulf of Mexico during the day on the 26th and moved northeast into Alabama by the morning of the 27th. It continued moving northeast and was well east of the North Carolina coast by the morning of the 28th.
Local Discussion
Snow overspread the southern half of the state during the evening of the 27th. Snow progressed into central New Jersey but then stalled, reaching Hunterdon, Somerset, and Essex counties in the form of flurries. Snow was heaviest over Cumberland, Cape May and Atlantic counties during the early morning hours of the 28th. Snow tapered off from west to east across the state just after dawn on the 28th. Total snow accumulations ranged from 3 to 5 inches in Atlantic County, 2 to 4 inches in Cape May and Cumberland Counties, 1 to 3 inches in Salem, Gloucester, Camden, Burlington, and Ocean counties, and 1 to 2 inches in Mercer and Monmouth counties. Areas further north received less than 1 inch.
New Jersey Snowfall Totals
Individual Snowfall Totals from February 27-28, 2003
Table of Contents
Storm Summary
Regional Surface Observations
National Weather Service Forecasts
Surface Maps
Satellite Imagery
National Surface Weather Maps - Pressure and Fronts Only
Continental Surface Weather Maps - Pressure and Fronts Only
Sea Level Pressure and 1000 to 500 Millibar Thickness Maps
850 Millibar Maps
700 Millibar Maps
500 Millibar Maps
300 Millibar Maps
200 Millibar Maps
National Radar Imagery
Regional Radar Imagery
Local Radar Imagery
Fort Dix Doppler Radar Imagery
Storm Photos
Snow storm, December 5, 2002
Snow and ice storm, December 24-26, 2002
Snow storm, January 5, 2003
Snow storm, January 16-17, 2003
Snow storm, January 29, 2003
Snow storm, February 6-7, 2003
Snow storm, February 16-17, 2003
Snow storm, February 27-28, 2003
Snow and ice storm, March 6, 2003
Snow and ice storm, April 7, 2003
Back to Ray's Winter Storm Archive
Copyright © 2012 by Raymond C Martin Jr. All rights reserved