

Storm description, surface observations, snowfall totals, and images courtesy of the National Climatic Data Center, the National Centers of Environmental Prediction, the Climate Prediction Center, the Hydrometeorological Prediction Center, the Mount Holly National Weather Service Office, the Upton National Weather Service Office, Rutgers University, Plymouth State University, the University of Illinois, the American Meteorological Society, Weather Graphics Technologies, AccuWeather, and the Weather Channel.
Table of Contents
Storm Summary
Regional Surface Observations
National Weather Service Forecasts
Surface Maps
Satellite Imagery
National Surface Weather Maps - Pressure and Fronts Only
Continental Surface Weather Maps - Pressure and Fronts Only
Sea Level Pressure and 1000 to 500 Millibar Thickness Maps
850 Millibar Maps
700 Millibar Maps
500 Millibar Maps
300 Millibar Maps
200 Millibar Maps
National Radar Imagery
Regional Radar Imagery
Local Radar Imagery
Fort Dix Doppler Radar Imagery
Storm Photos
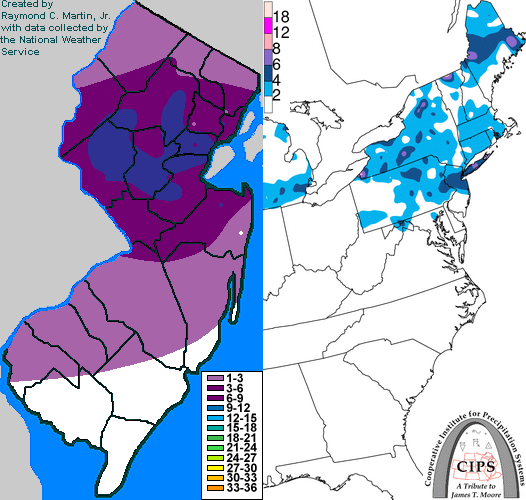
Contoured Snowfall Totals from April 7, 2003
STORM DESCRIPTION
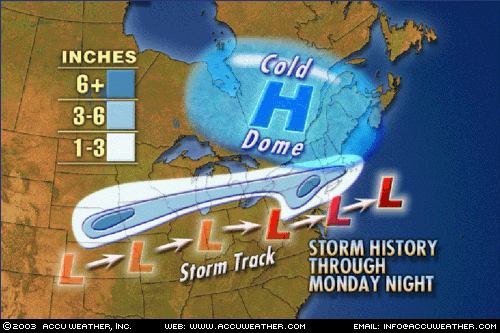
Another low pressure area passing south of the Delmarva, combined with a strong Arctic high pressure area crossing New England, produced the final snowstorm of the 2002-2003 winter season.
Synoptic Discussion
The primary low pressure system moved from the Gulf Coast states on the 6th into the Tennessee Valley on the night of the 6th. At the same time, an unusually strong and cold (for April) Arctic high pressure system moved into New England. As the primary low pressure moved into Ohio on the morning of the 7th, a secondary low pressure began to develop near Cape Hatteras, North Carolina. The primary low weakened during the day on the 7th, and the secondary low became the primary low as it moved northeastward. It was near Wallops Island, Virginia by the evening of the 7th and then quickly moved well offshore by the morning of the 8th.
Local Discussion
Precipitation spread across the state from southwest to northeast during the morning of the 7th. In Cape May County, precipitation began as rain and never mixed with sleet or snow. Atlantic and Cumberland counties saw precipitation begin as a mixture of rain, sleet and snow, but precipitation quickly changed to all rain. Further north, in Salem, Gloucester, Camden, Burlington and Ocean counties, precipitation began as a mix of snow and sleet, and from Mercer and Middlesex counties northward, precipitation began as all snow. Precipitation was heavy for several hours during the late morning and early afternoon hours, allowing the snow and sleet to accumulate quickly. Warmer air then began to move in from the southwest at mid-levels of the atmosphere. Because surface temperatures were already just above freezing in Salem, Gloucester, Camden, Burlington and Ocean counties, precipitation changed to plain rain as the warmer air moved in aloft. From Mercer and Middlesex counties northward, surface temperatures were below freezing, so as the warmer air moved in aloft the snow changed to a mixture of sleet and freezing rain. Easterly winds from the ocean were able to warm temperatures in eastern parts of central and northern New Jersey above freezing, and precipitation in Monmouth, Middlesex, Union, Essex, Hudson, Bergen and Passaic counties then changed to a mixture of rain, sleet and snow. Further inland, the ocean air had little influence and temperatures remained below freezing at the surface. This caused precipitation to remain in frozen form, and continued to fall as freezing rain, sleet and some snow through the evening hours. Precipitation gradually tapered off from southwest to northeast late in the evening of the 7th. Snow totals were largest in north-central parts of the state, ranging from 6 to 8 inches in Union County, 4 to 8 inches in Middlesex and Somerset counties, 1 to 8 inches in Monmouth County, 4 to 7 inches in Morris, Hunterdon, Essex, and Hudson counties, 3 to 6 inches in Mercer and Warren counties, 2 to 4 inches in Bergen, Passaic and Sussex counties, and 1 to 3 inches in Ocean, Burlington, Camden, Gloucester, and Salem counties. This last storm confirmed the Winter of 2002-2003 as one of the 10 snowiest across most of the New Jersey, and as the snowiest winter since the Winter of 1995-1996, the snowiest winter on record.
New Jersey Snowfall Totals
Individual Snowfall Totals from April 7, 2003
Regional Snowfall Totals
Snow Totals from 1200Z 08 April 2003 (8AM EDT 08 April 2003)
Table of Contents
Storm Summary
Regional Surface Observations
National Weather Service Forecasts
Surface Maps
Satellite Imagery
National Surface Weather Maps - Pressure and Fronts Only
Continental Surface Weather Maps - Pressure and Fronts Only
Sea Level Pressure and 1000 to 500 Millibar Thickness Maps
850 Millibar Maps
700 Millibar Maps
500 Millibar Maps
300 Millibar Maps
200 Millibar Maps
National Radar Imagery
Regional Radar Imagery
Local Radar Imagery
Fort Dix Doppler Radar Imagery
Storm Photos
Snow storm, December 5, 2002
Snow and ice storm, December 24-26, 2002
Snow storm, January 5, 2003
Snow storm, January 16-17, 2003
Snow storm, January 29, 2003
Snow storm, February 6-7, 2003
Snow storm, February 16-17, 2003
Snow storm, February 27-28, 2003
Snow and ice storm, March 6, 2003
Snow and ice storm, April 7, 2003
Back to Ray's Winter Storm Archive
Copyright © 2012 by Raymond C Martin Jr. All rights reserved